About
New York State preliminary heat maps were developed using the i-Tree Cool Air model, a physically based analytical spatial air-temperature and humidity model developed to map urban heat islands and cooling potential of urban forests.
1
These preliminary heat maps are available for download as .TIF and .SHP files, in addition to .JPG maps. Downloads are available on each urban area and county page in addition to statewide downloads available on the Home page.
Hottest-Hour Maps
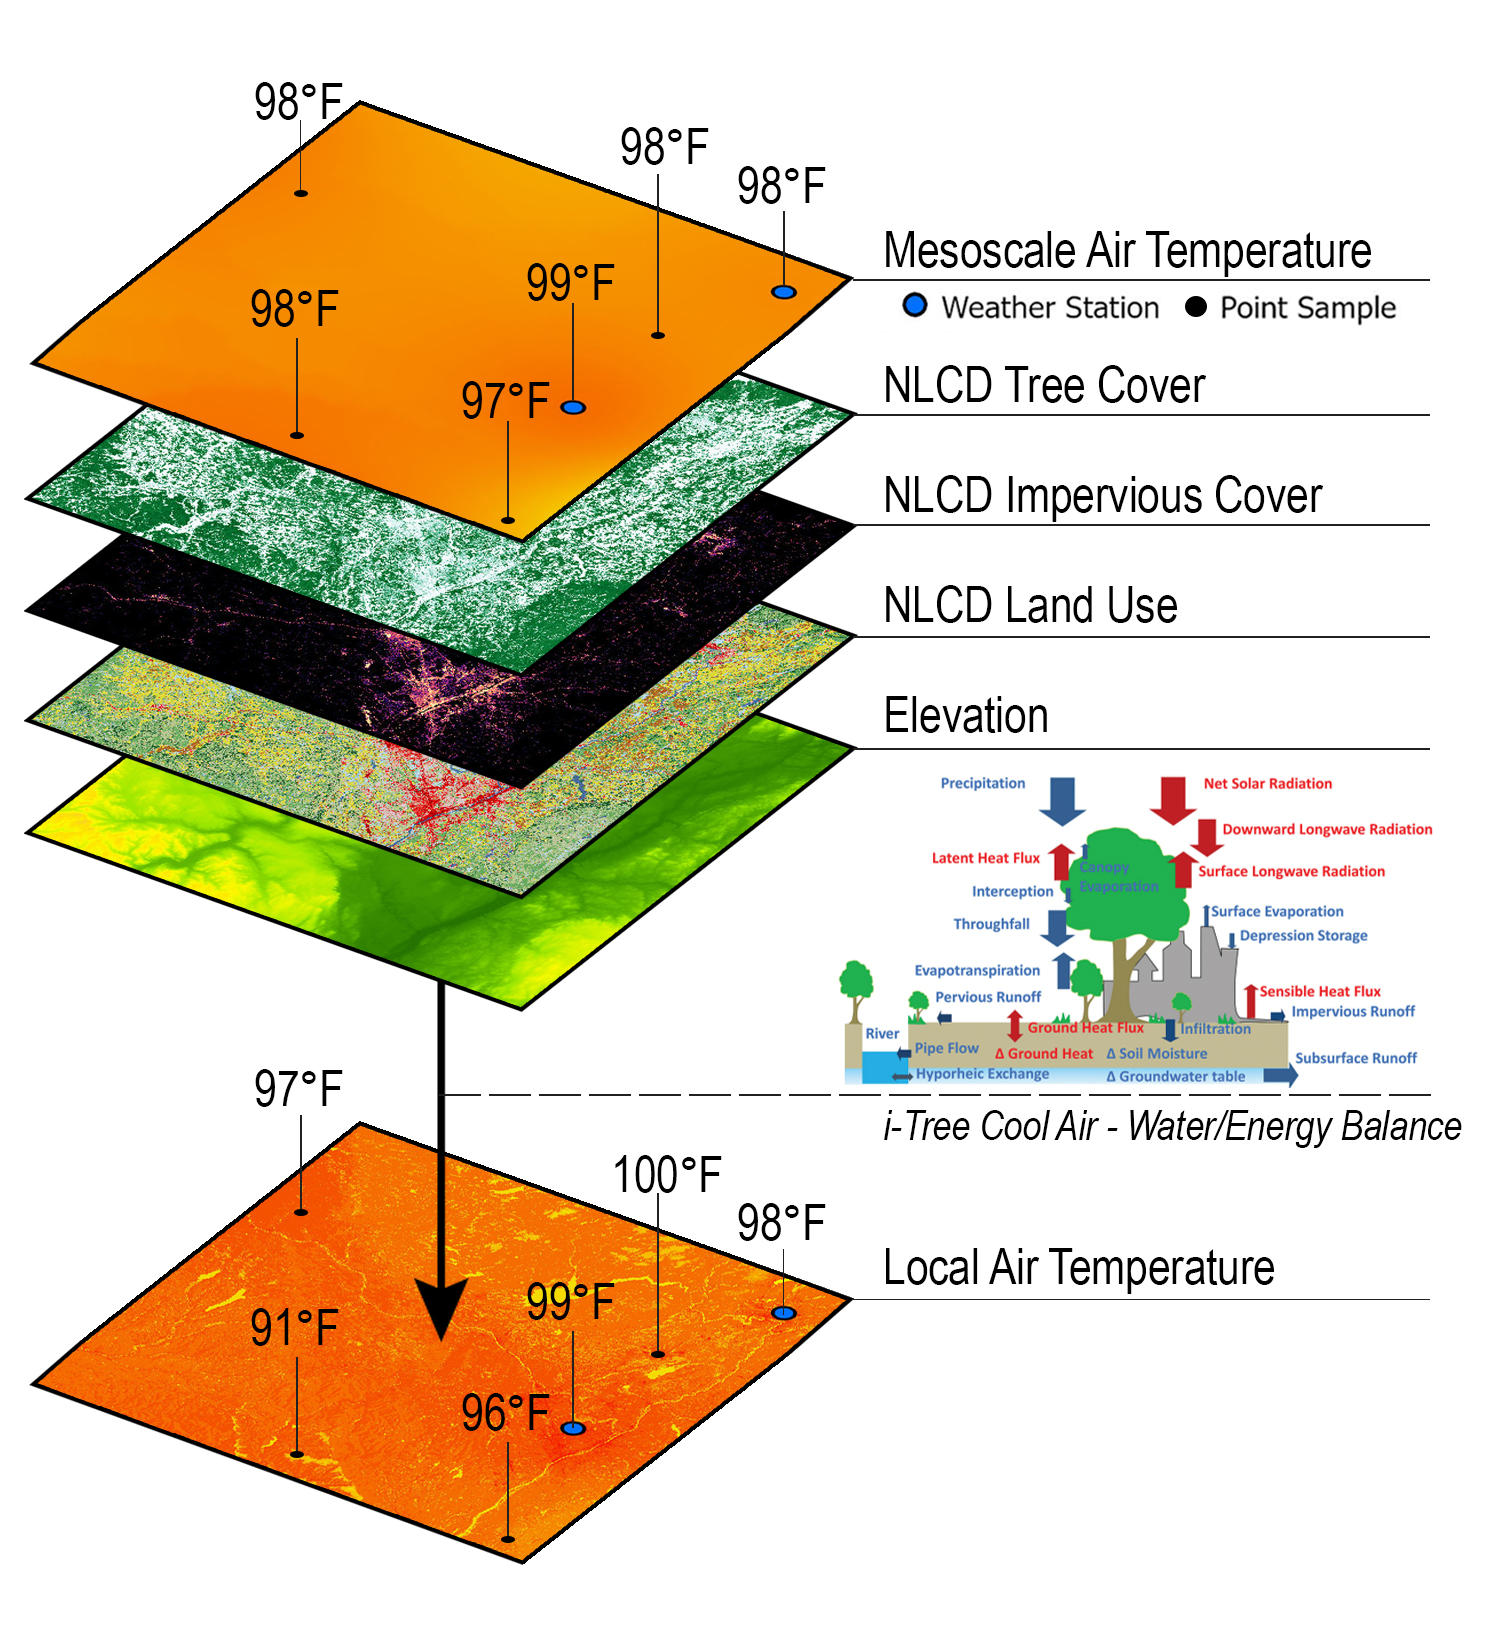
The state maps depict the intensity of heat exposure, identified as the “hottest hour” for a geographic location from the previous decade. Using historical weather station data, the hottest hour from each station between 2010-2020 was selected. The model first uses these stations as an input to create a weighted map of the mesoscale (upper-boundary) air temperature across the state. Each 30m pixel has assigned land use, impervious cover, tree cover, and elevation values that the Cool Air model uses to solve for the localized air temperature.
The coupled water-energy balance in i-Tree Cool Air was developed to capture how built and natural environments interact with incoming precipitation and runoff, in addition to how energy (i.e. radiation) is absorbed and emitted by varying surfaces. By balancing incoming and outgoing water and energy at each 30m cell, the model can calculate the local air temperature; capturing spatial variation of heat with urbanization, elevation, and vegetation. See More About i-Tree Cool Air below for more details.
Map Scale
Preliminary maps depict up to three measures of extreme heat:
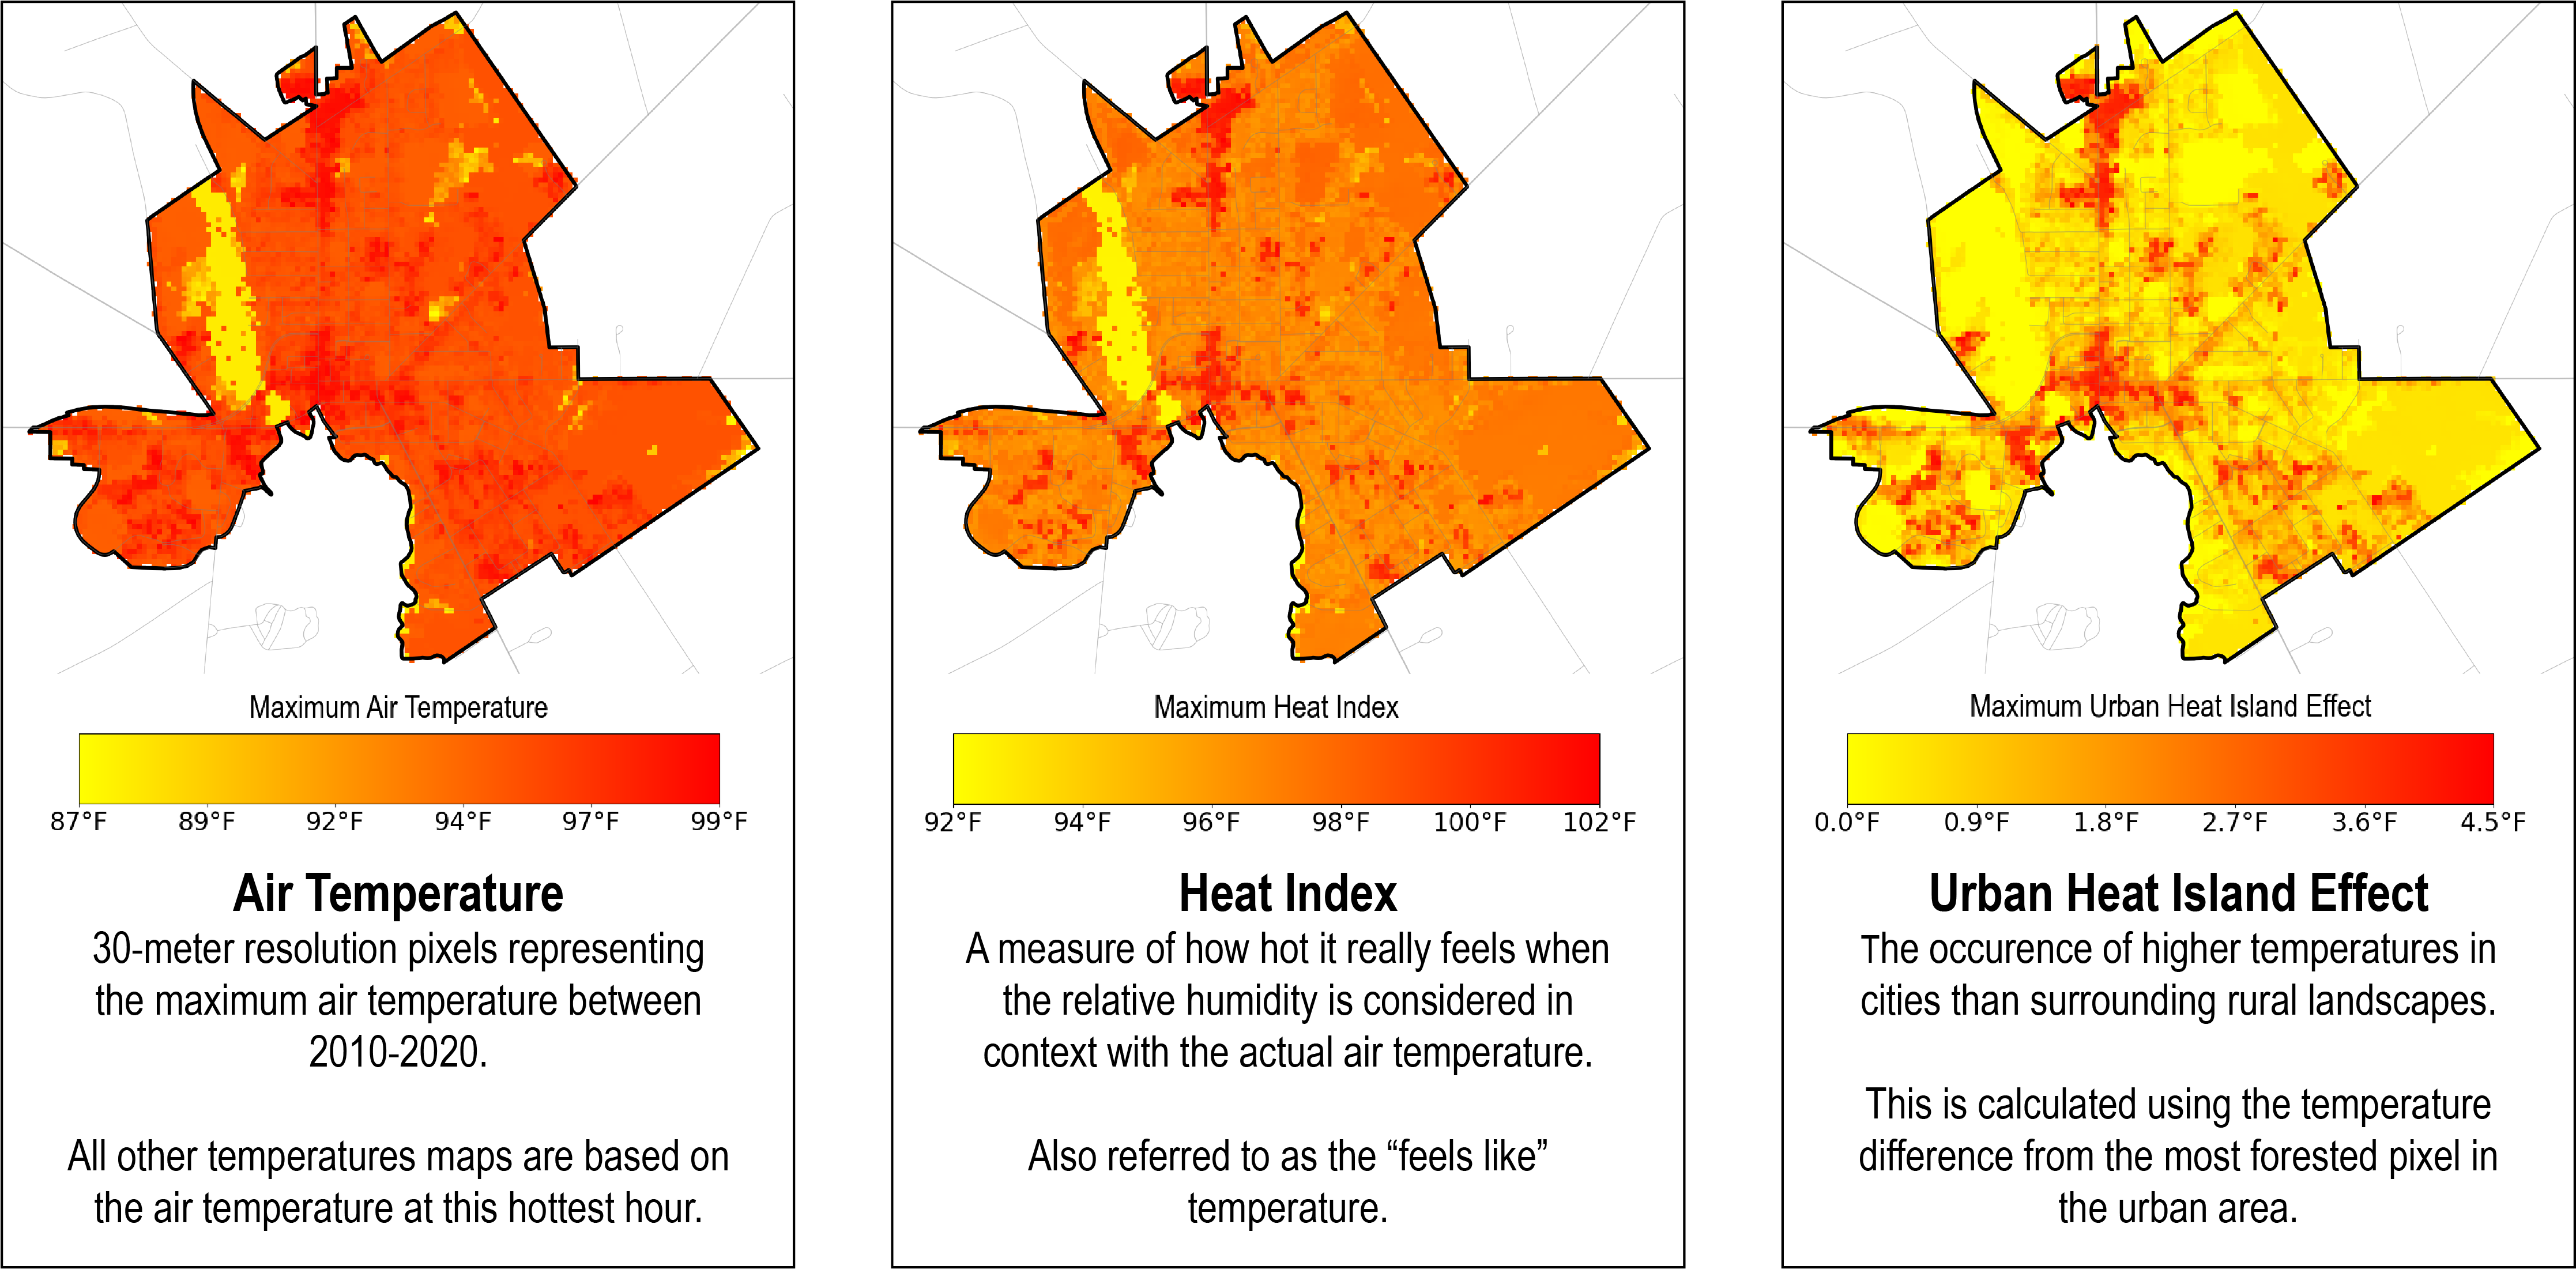
- Air Temperature 2 : simulated at a 6-foot height and 30m resolution for the maximum temperature between 2010-2020;
- Heat Index 3 : a measure of how hot it really feels when the relative humidity is combined with the actual air temperature;
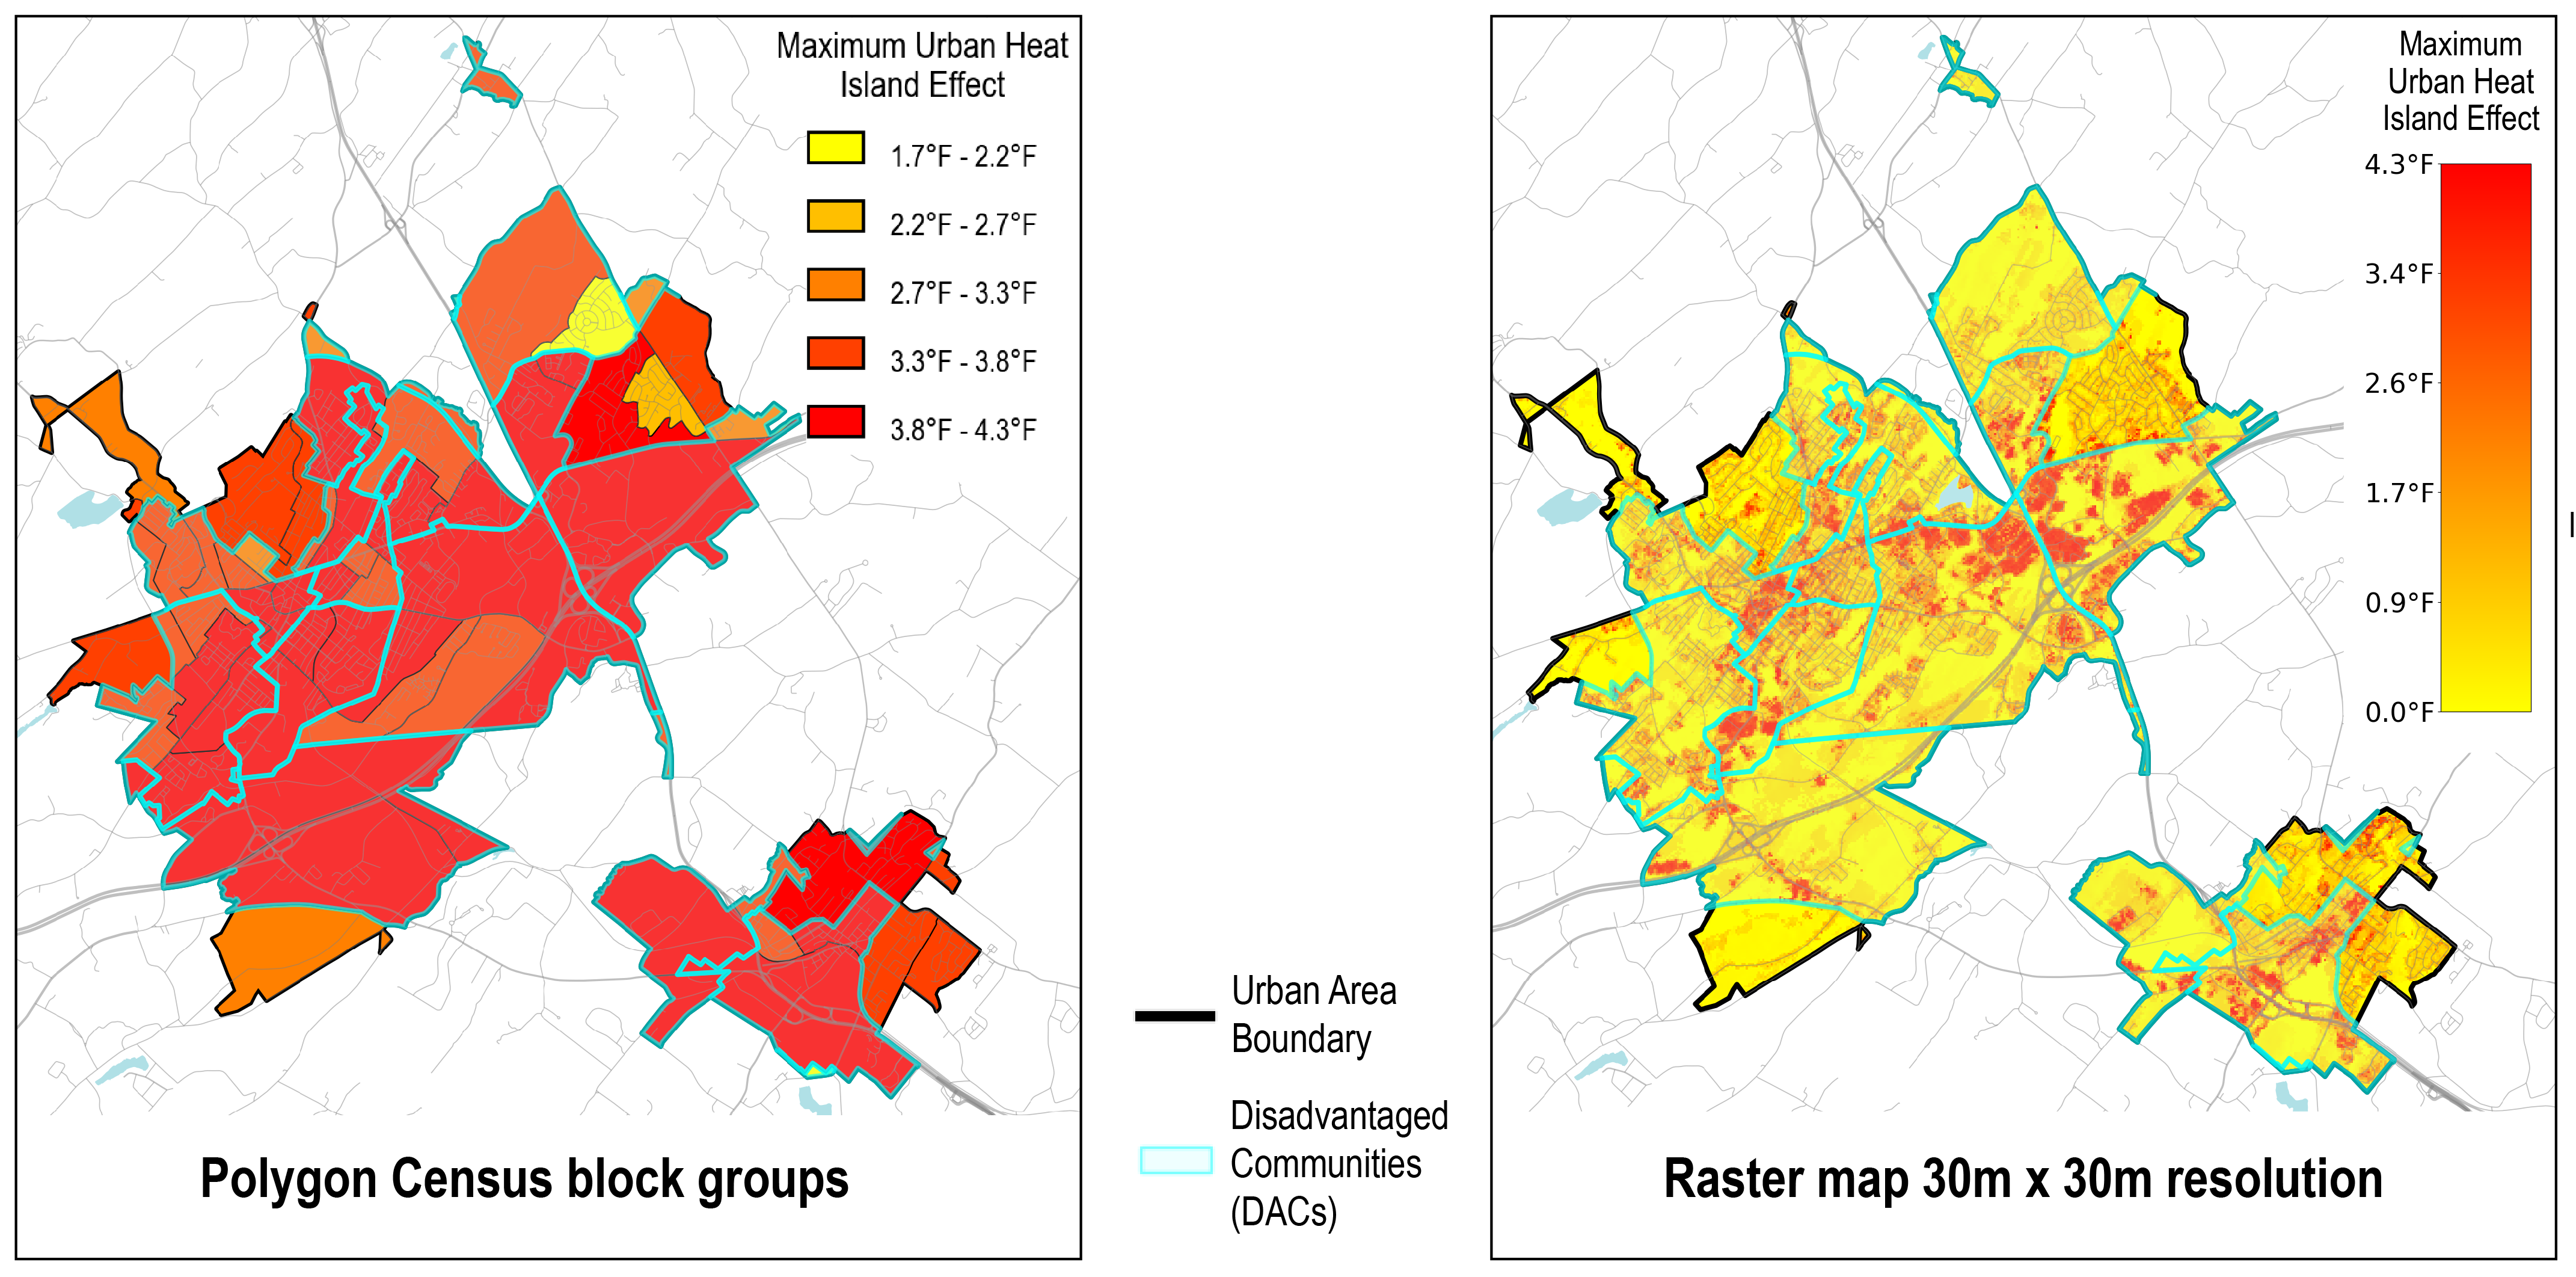
- Urban Heat Island Effect (UHI Effect) 4 : The occurrence of higher temperatures in cities than in surrounding landscapes. This is calculated with the temperature difference from the coolest land pixel. This was only calculated for urban areas given the large variances that can exist between urban areas within one county.
Draft static maps show each of the state's counties and metropolitan statistical areas (MSA) 5 , which are urban areas of at least 50,000 inhabitants and the surrounding area. These maps are available in two delineations:
- Polygon US Census block group maps 6 (spatially less detailed);
- Raster 7 maps at 30 m × 30 m (spatially more detailed).
The maps also depict the state disadvantaged communities (as of 2023) to allow for extreme heat analysis and mitigation efforts for the most underserved areas of New York. 8 Note: The New York State Climate Justice Working Group determines DAC criteria and may update the criteria and boundaries periodically.
Inputs
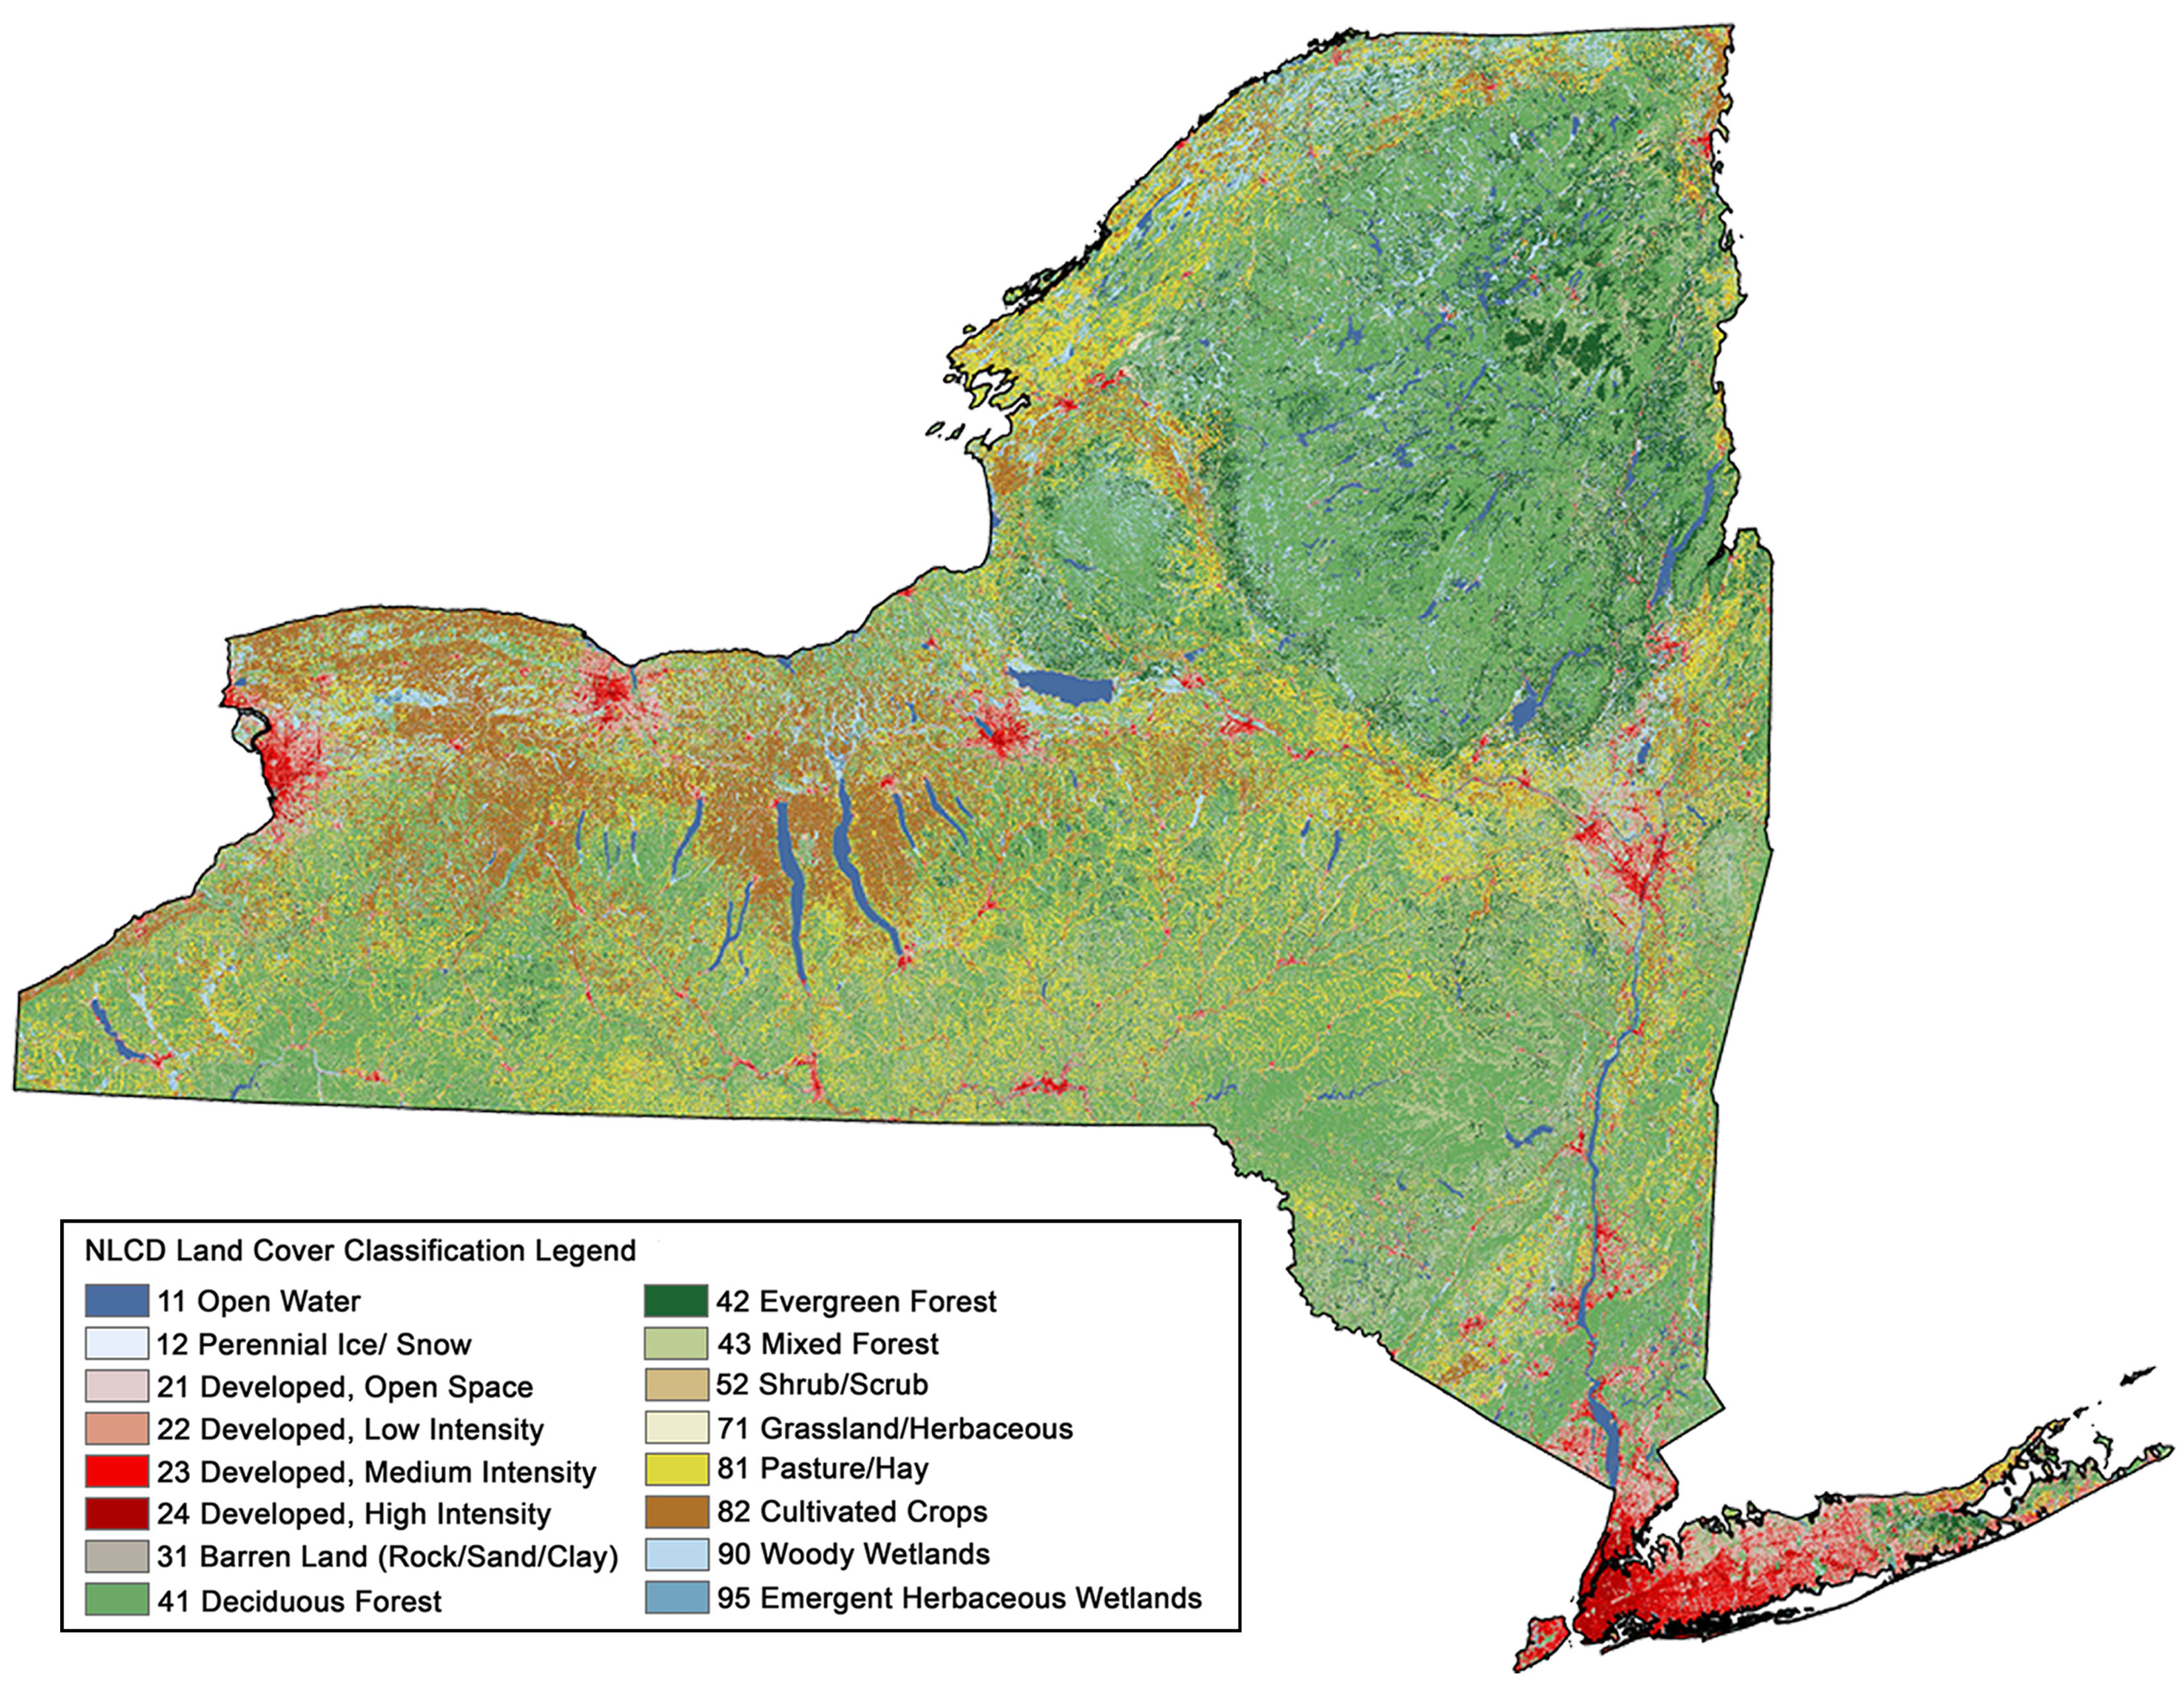
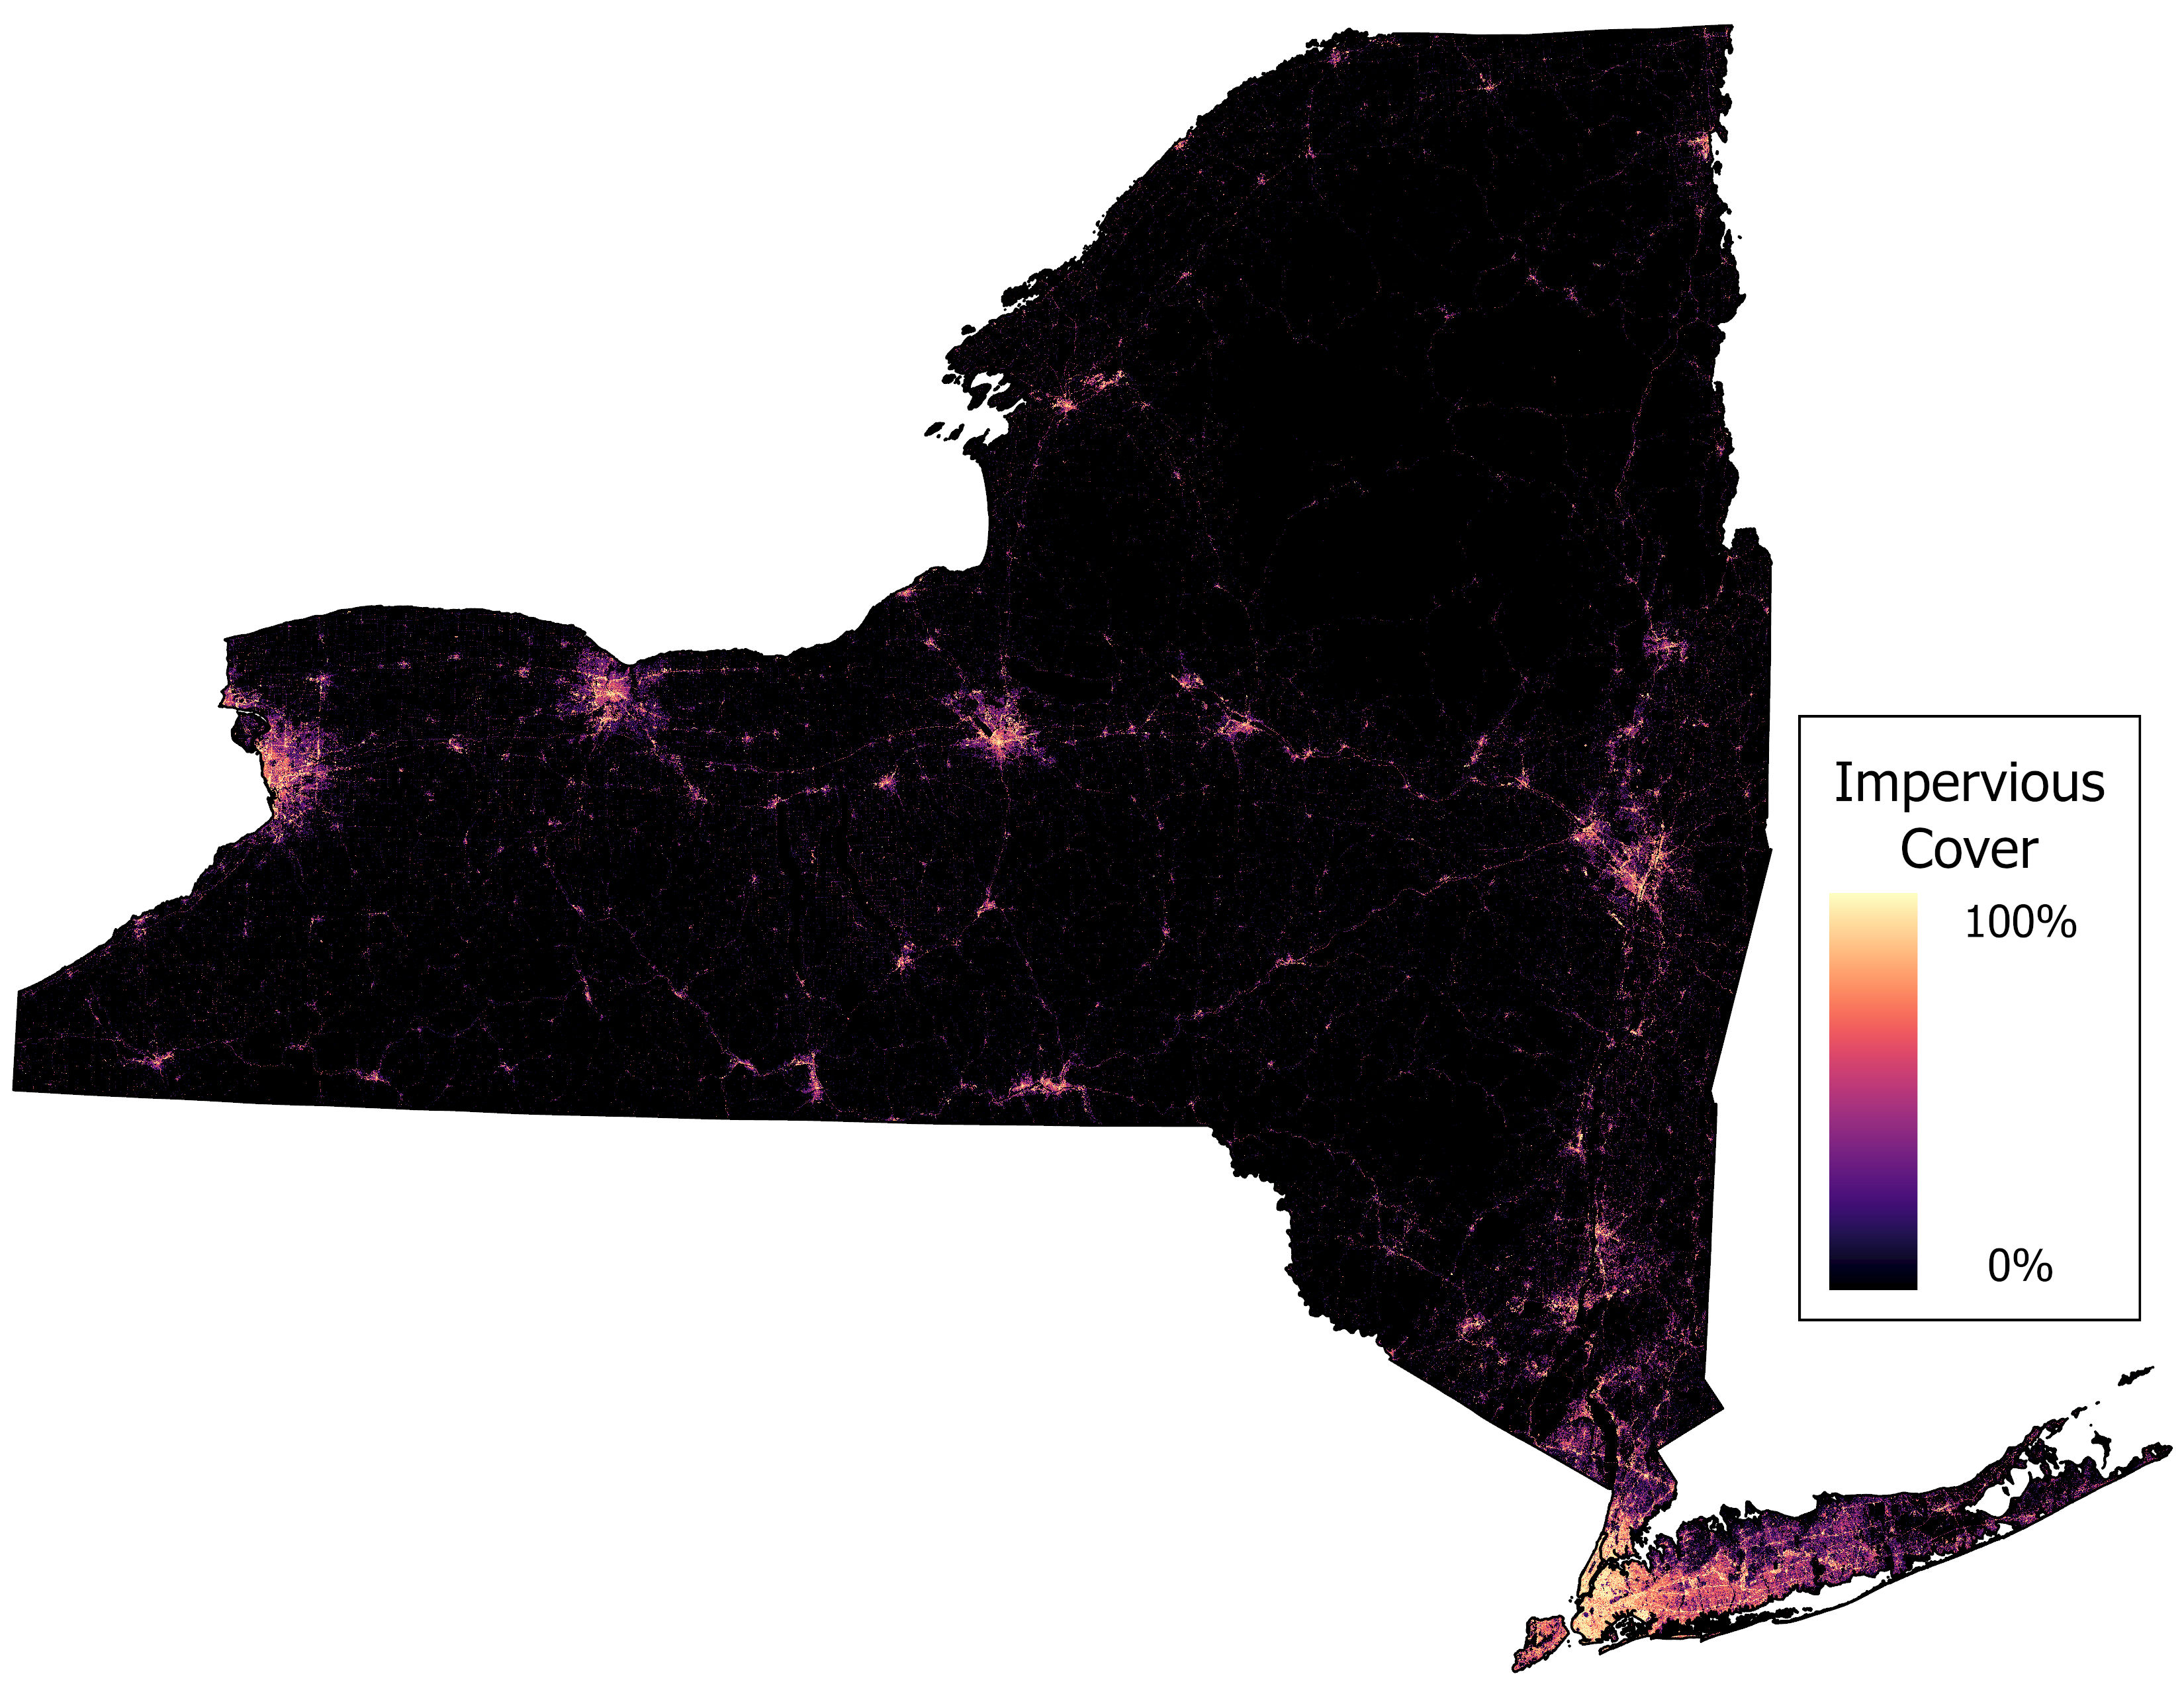
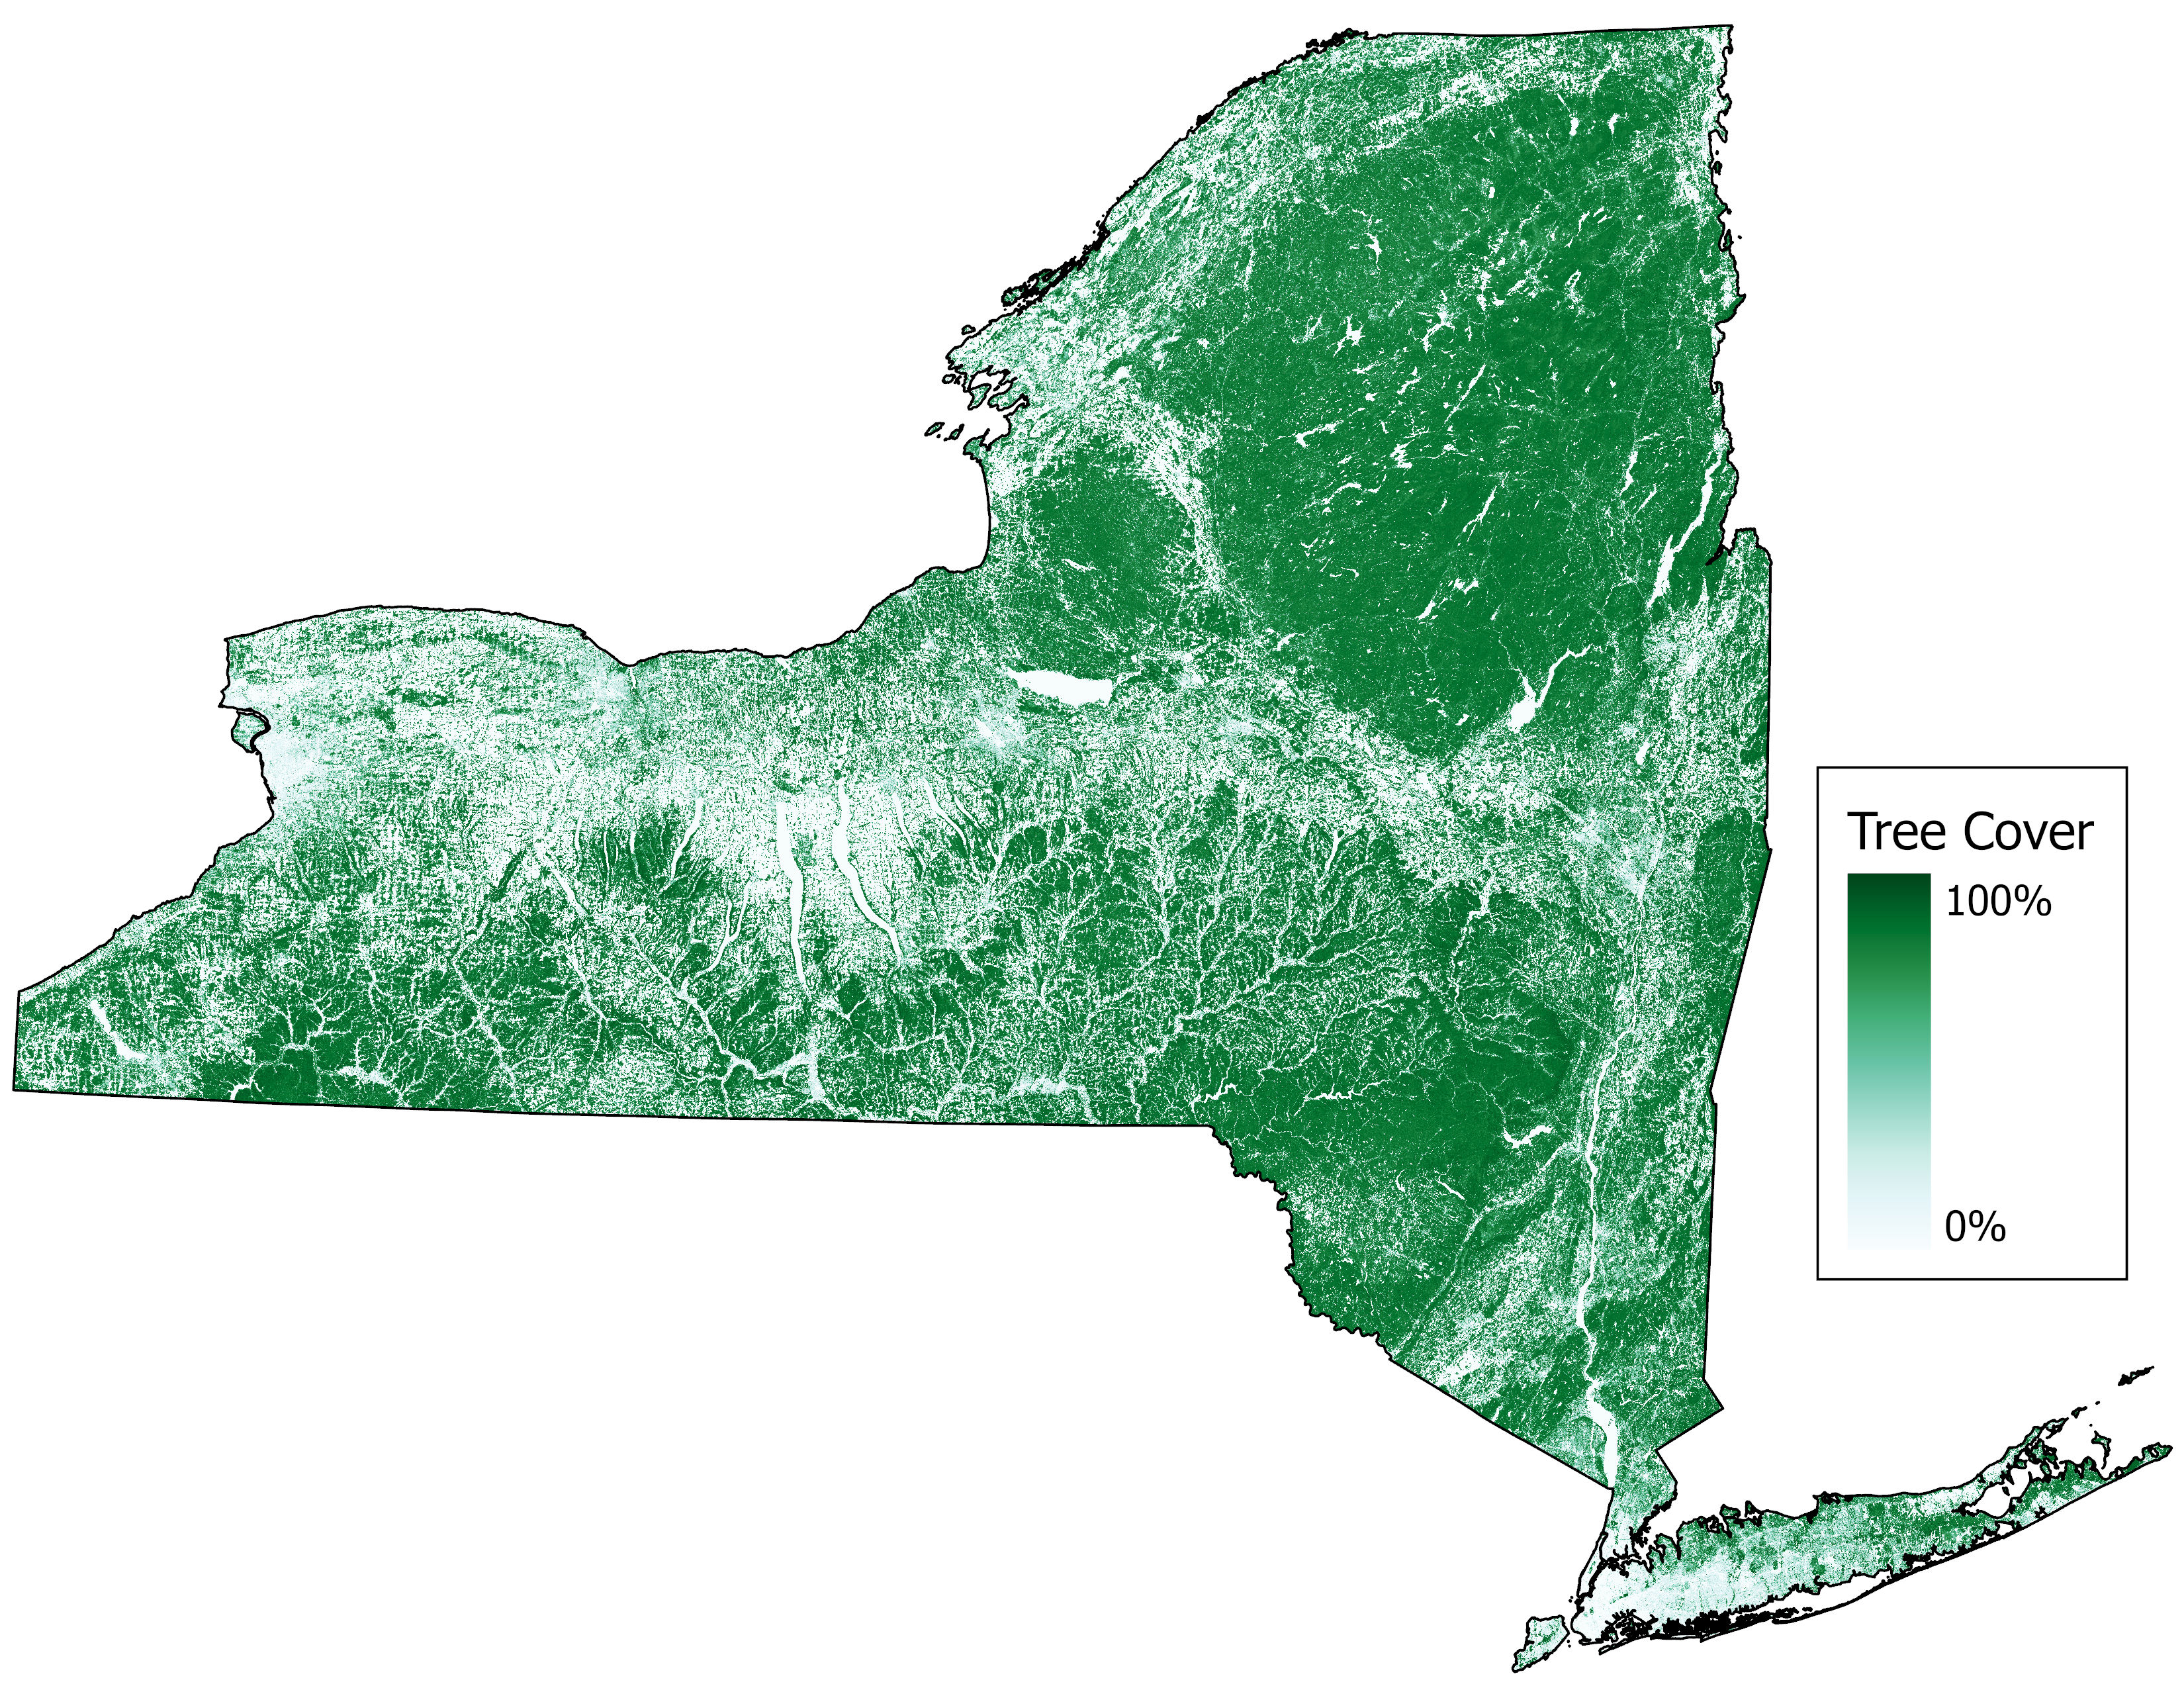
i-Tree Cool Air requires spatial raster inputs of land-use, impervious cover, tree cover, and elevation. It also needs weather and radiation data from a nearby station (often an airport) and allows numerous location-specific model adjustments from soil properties to impervious-surface albedo. For the statewide preliminary extreme heat maps, the following inputs were used:
-
2019 National Land Cover Database (NLCD)
9 Rasters:
- Land-Use (water, forest, grasslands, agricultural lands, urban areas)
- Impervious Cover (0 – 100%)
- Tree Cover (0 – 100%)
- NHDPlusV2 10: Digital Elevation Model Raster (meters)
- NCEI Integrated Surface Database 11: Hourly meteorology for 2010–2020 for 28 weather stations (23 in-state)
-
Model Parameter Adjustments (Input .XML):
- Statewide Soil Type: Silty clay loam
- Regional Values:
- Evergreen % of Urban Canopy
- Average Impervious Cover under Urban Tree Cover (TC_OIC)
- Location Values:
- LeafOn/LeafOff 12
- Hydrological calibration
![LeafOn [Julian Day] map](img/lc_leafon.jpg)
![LeafOff [Julian Day] map](img/lc_leafoff.jpg)
More About i‑Tree Cool Air
The i‑Tree Cool Air model uses terrain elevation to laterally redistribute subsurface water and represent soil wetness based on the topographic index, adhering to TOPMODEL theory. 13 It operates in tandem with the i‑Tree Hydro model, which represents hydrologic similarity across 30 topographic‑index bins to simulate temporally varying soil‑moisture deficit (comparable to groundwater‑table depth).
The Hydro model was calibrated with two full water years (October 1, 2011 - September 30, 2013). Calibration produced three groundwater parameters—initial groundwater‑drainage rate, depth to vadose zone, and a hydraulic‑conductivity decay parameter—anchored to an average soil‑moisture deficit for each region, then passed to Cool Air for fully distributed 30 m simulations.
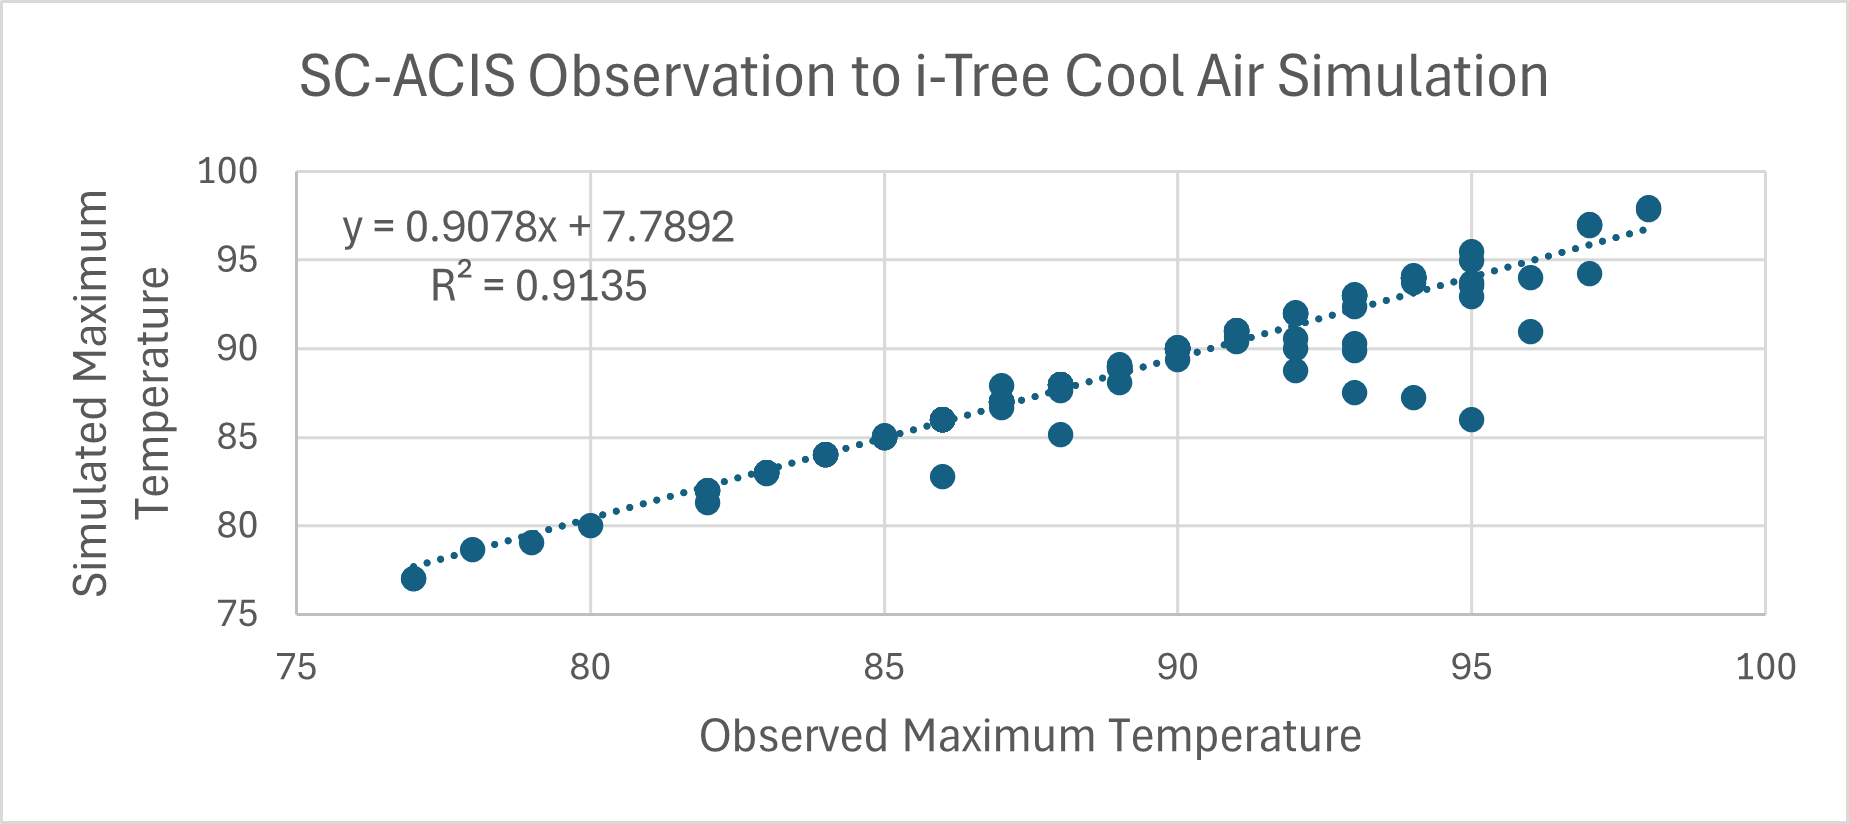
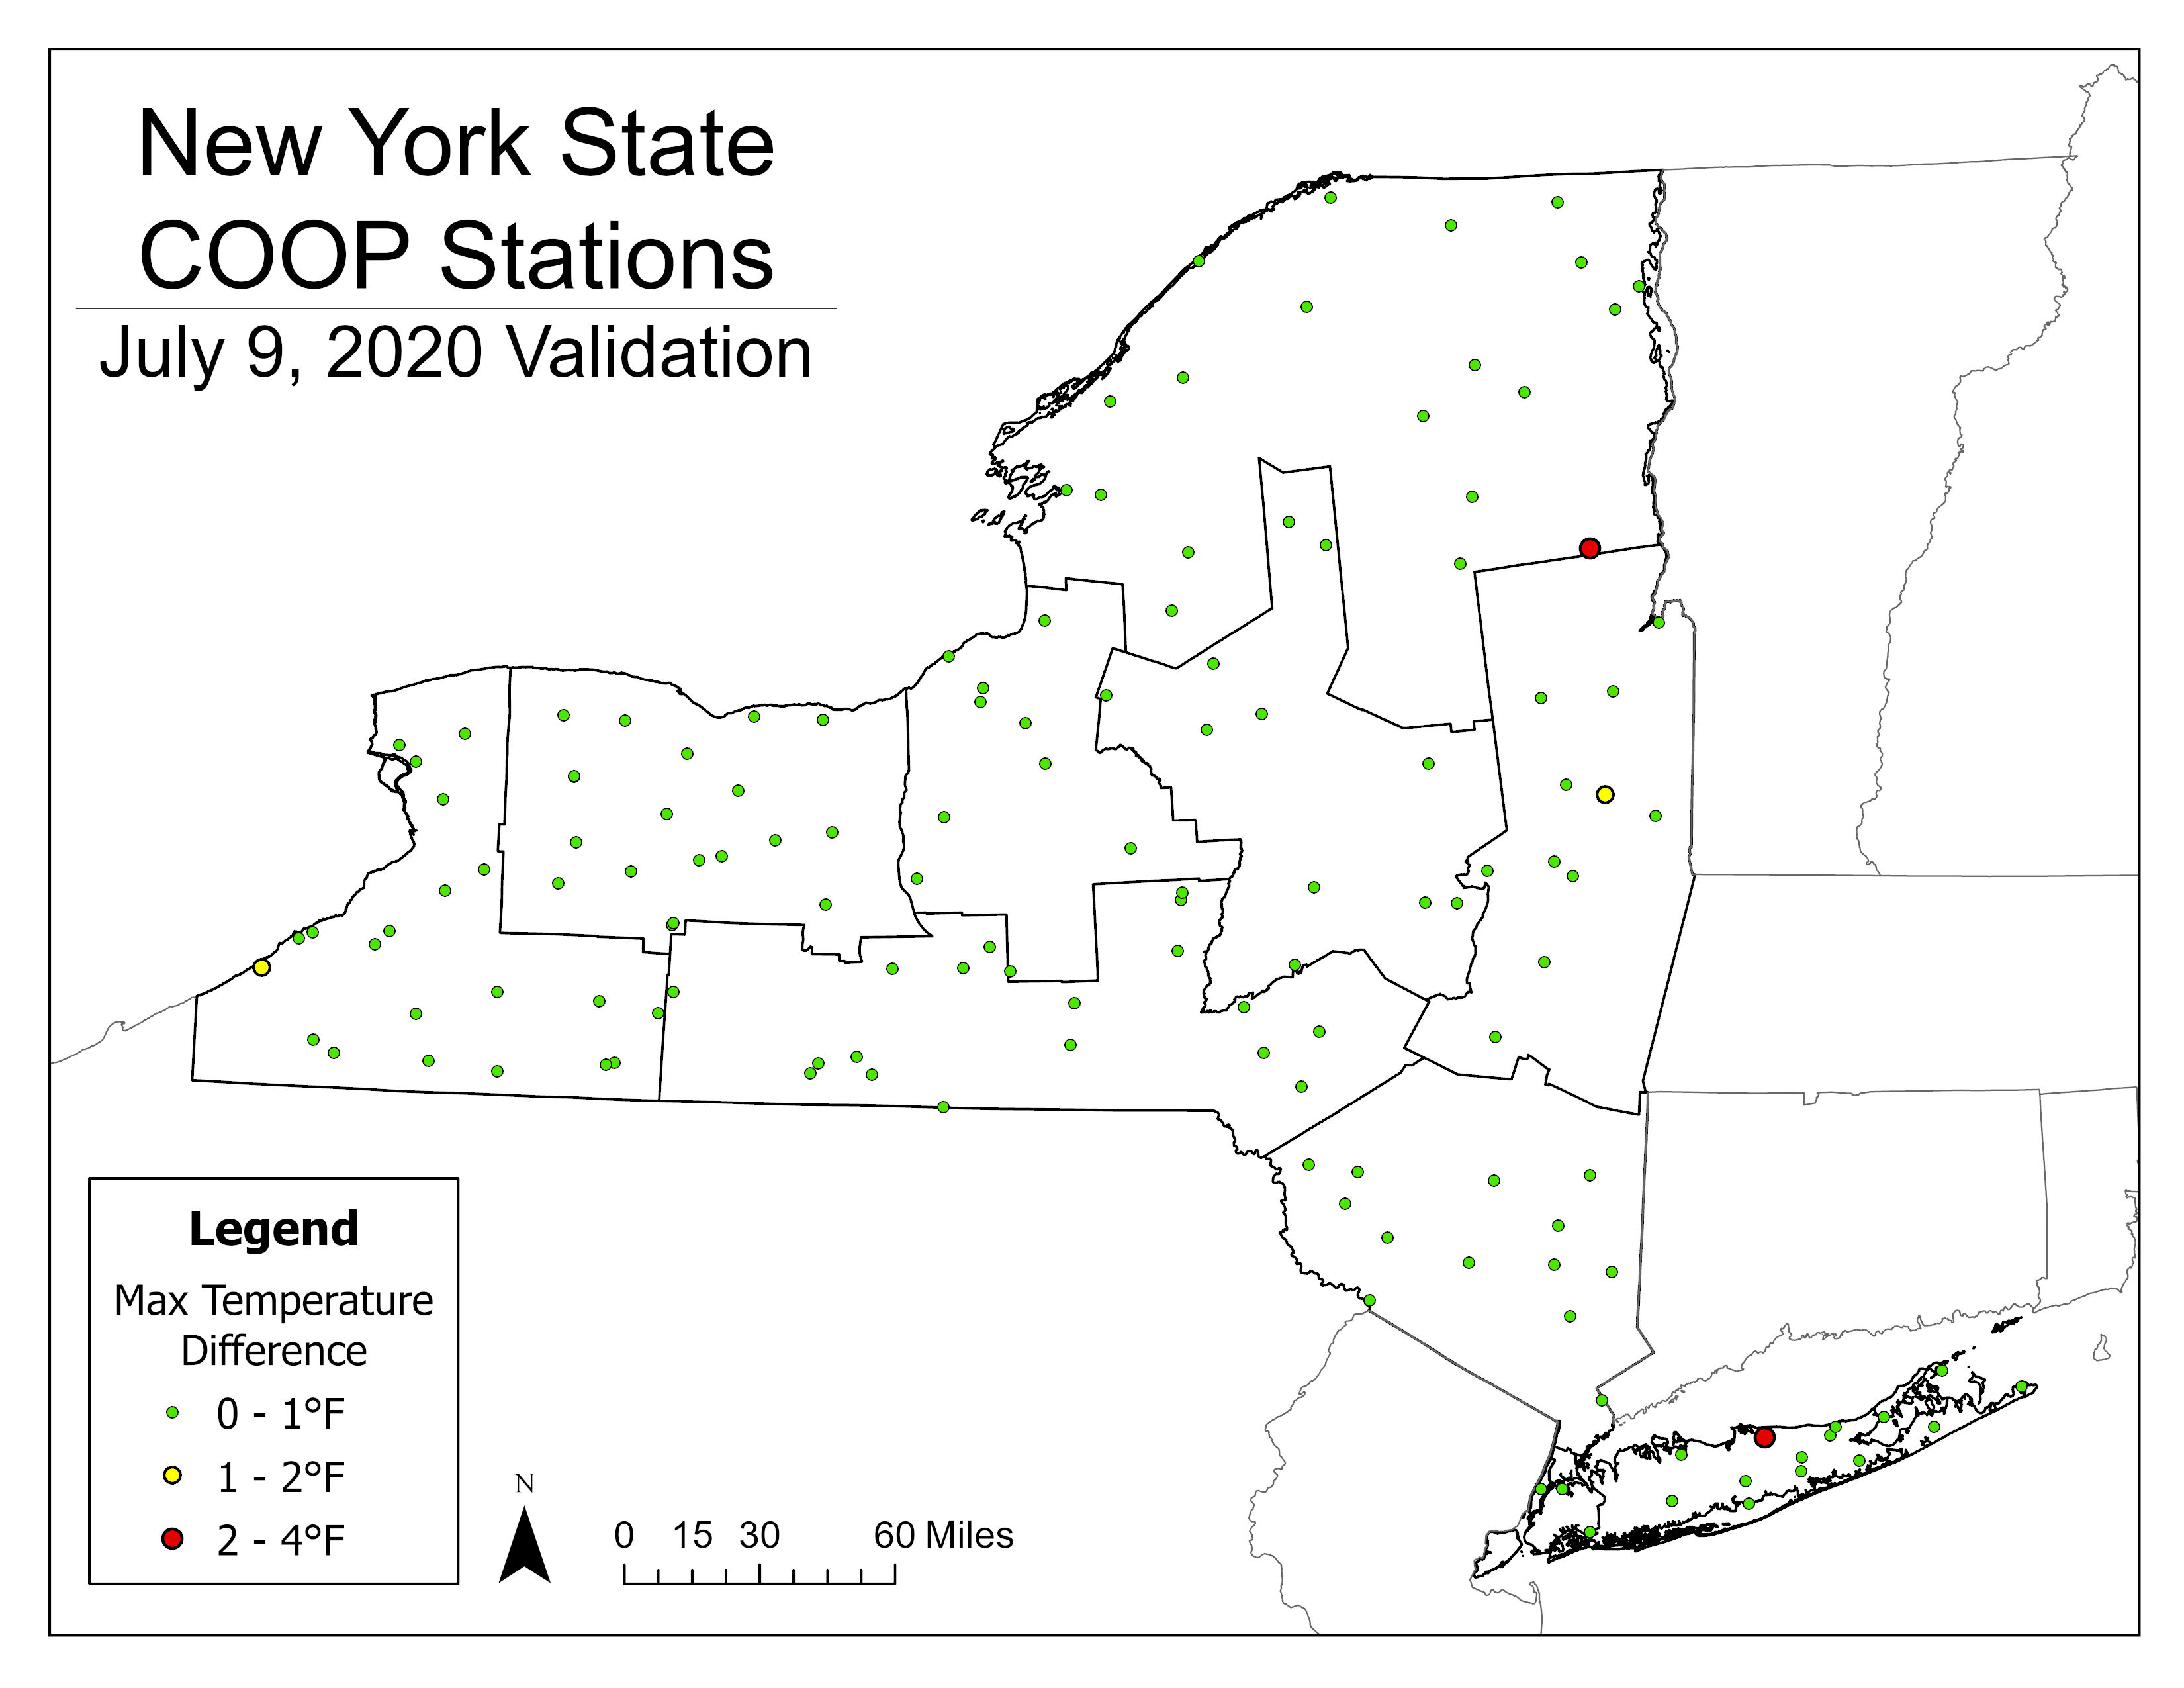
Model skill was confirmed by simulating July 9, 2020 statewide and validating maximum daily temperatures against 160 station observations from the SC-ACIS network. 14
Areas of the highest error are explained by higher tree cover in the local area that is not always reflected at a 30-meter resolution.
Next Steps in the Project
Future phases will simulate historic (2010-2019) and mid-century (2050-2059) heat-wave scenarios under climate-change projections to study exposure risks to heat over time. 15 Products from this phase will be available for download in 2026. Unlike the preliminary single-hour, 30 m products, the next phase will provide 20 years of hourly and daily data at 300 m resolution.
Statistics will summarize:
- National Heat Advisory — expected maximum heat index 100 ‑ <105 °F for ≥ 2 days; nighttime ≥ 75 °F 16
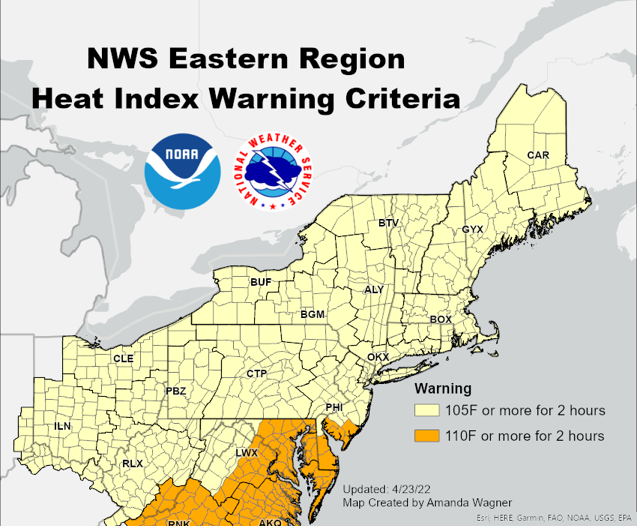
- National Excessive Heat Warning — expected maximum heat index ≥ 105 °F for ≥ 2 days; nighttime ≥ 75 °F 16
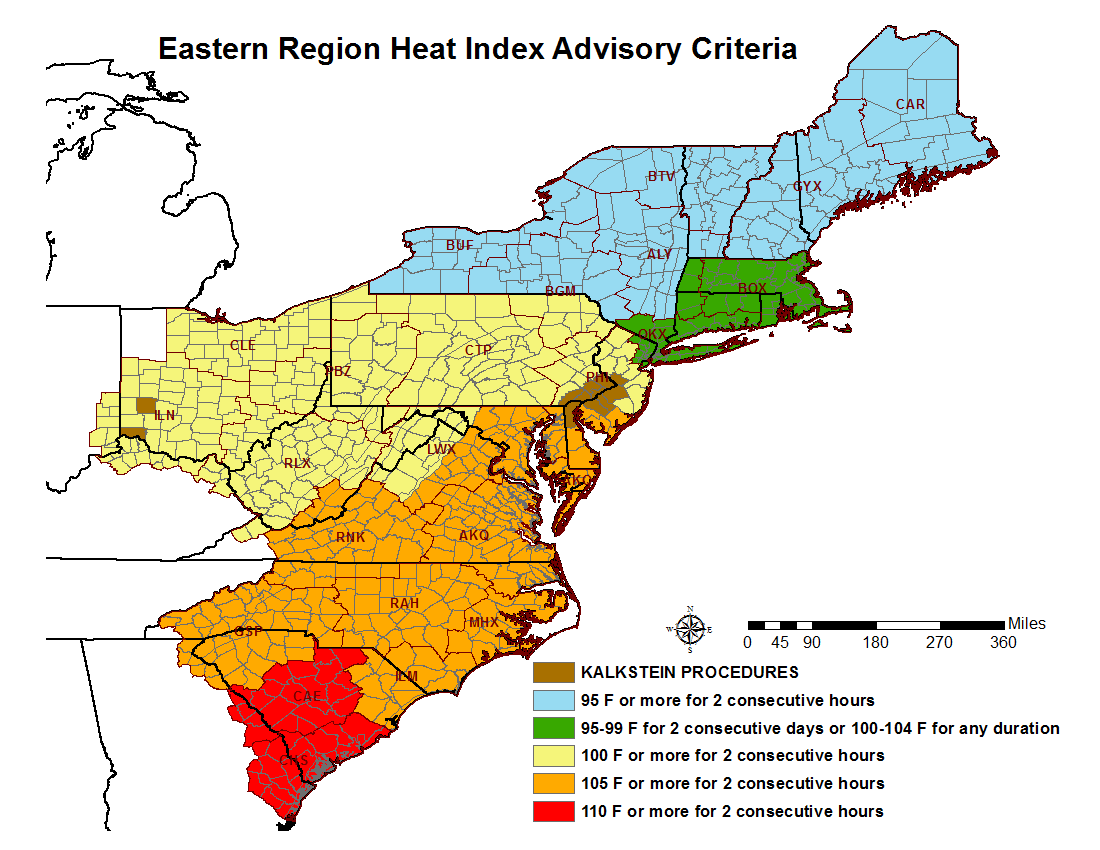
- New York State Heat Advisory — maximum heat index 95 - <105 °F for ≥ 2 consecutive hours 17
- New York State Excessive Heat Warning — maximum heat index ≥ 105 °F for ≥ 2 consecutive hours 17
- Minimum, maximum, and mean daily values for each of the three data types: air temperature, heat index, and wet bulb globe temperature (WBGT) 17