About the Project
Urban heat islands (opens in new tab)
are developed areas with less natural green space that experience higher temperatures
than surrounding areas. These higher temperatures can increase risks to human health and place additional
stress on buildings, infrastructure, and energy systems.
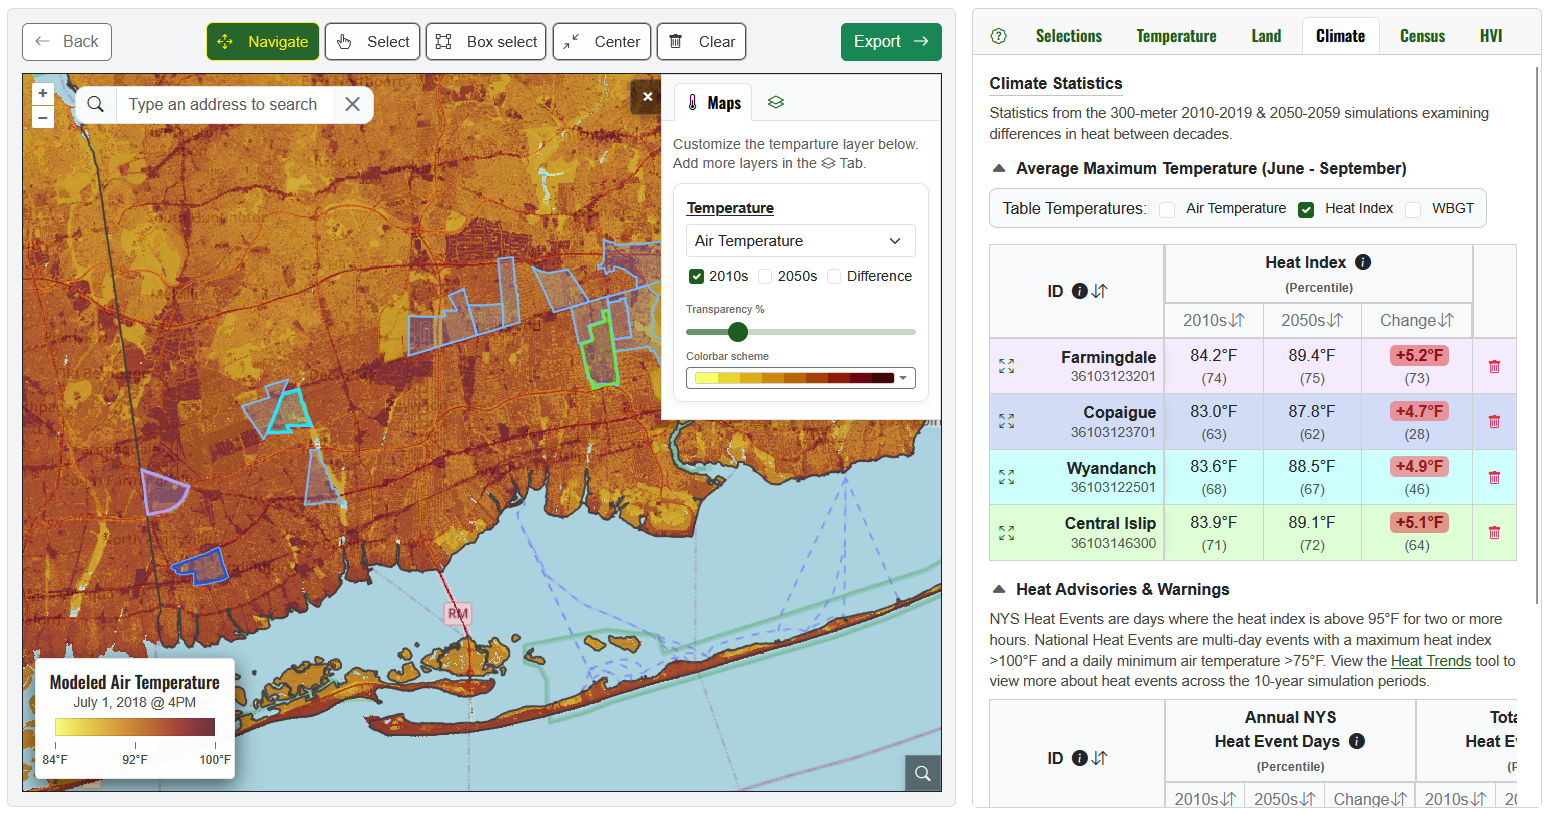
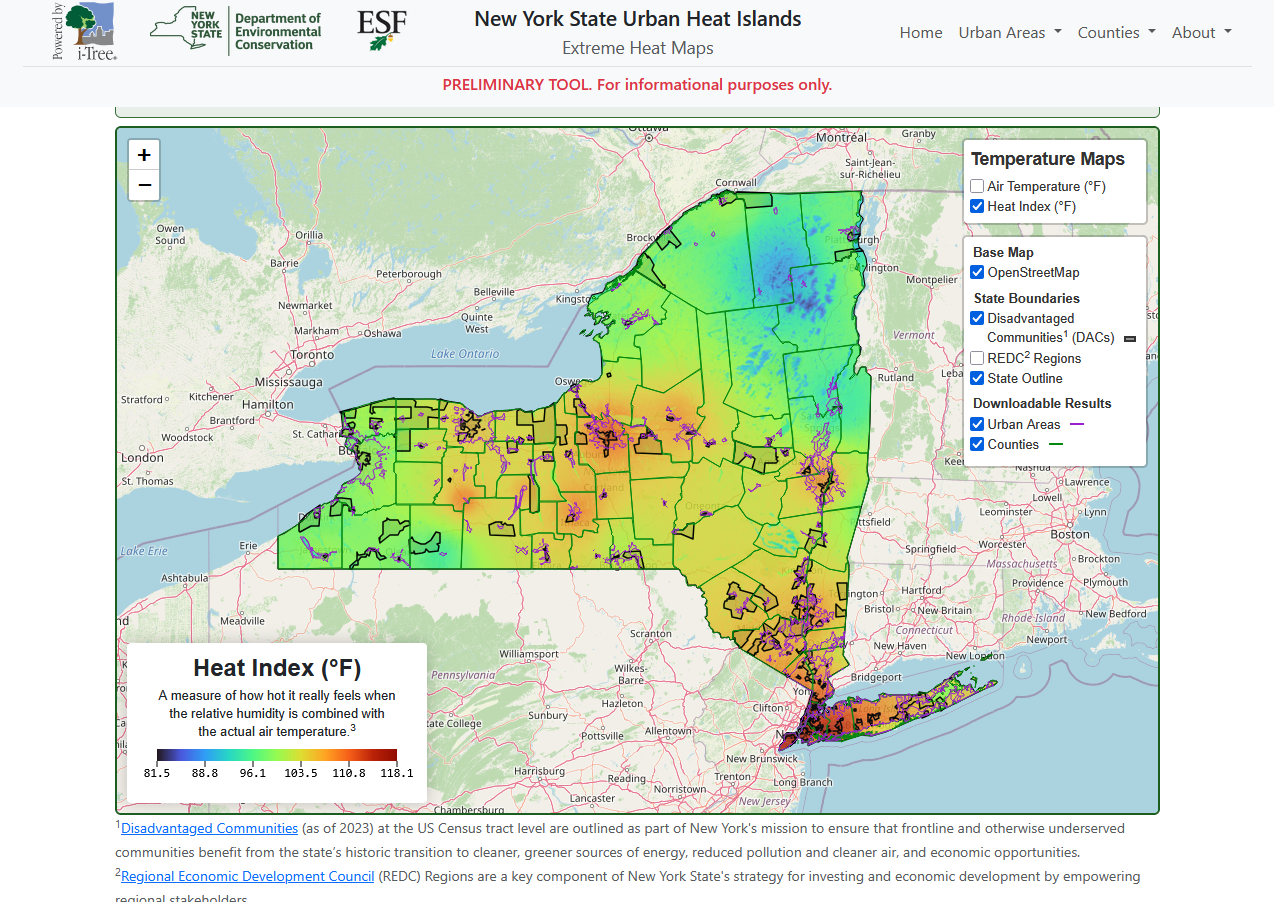
The tools on this website aim to support identification and analysis of urban heat islands and high temperatures,
particularly where there are communities more susceptible to illness or injury in extreme heat. Learn more from
DEC Extreme Heat (opens in new tab),
MitigateNY's Extreme Heat Risk Profile (opens in new tab),
and the
New York State Climate Impact Assessment (opens in new tab).
The tools on this website can support several practical planning and
communication needs, including:
Climate and community planning — Users can explore where heat may become more
frequent and intense with changing climate. This information can support climate adaptation planning,
community discussions, and efforts to identify areas that may benefit from further study or engagement.
Investments and infrastructure — Local heat patterns can provide useful context
when evaluating buildings, transportation systems, public spaces, and other investments. They can
also help communities consider where trees, vegetation, shade, cooling resources, or other heat-reduction
strategies may warrant further evaluation.
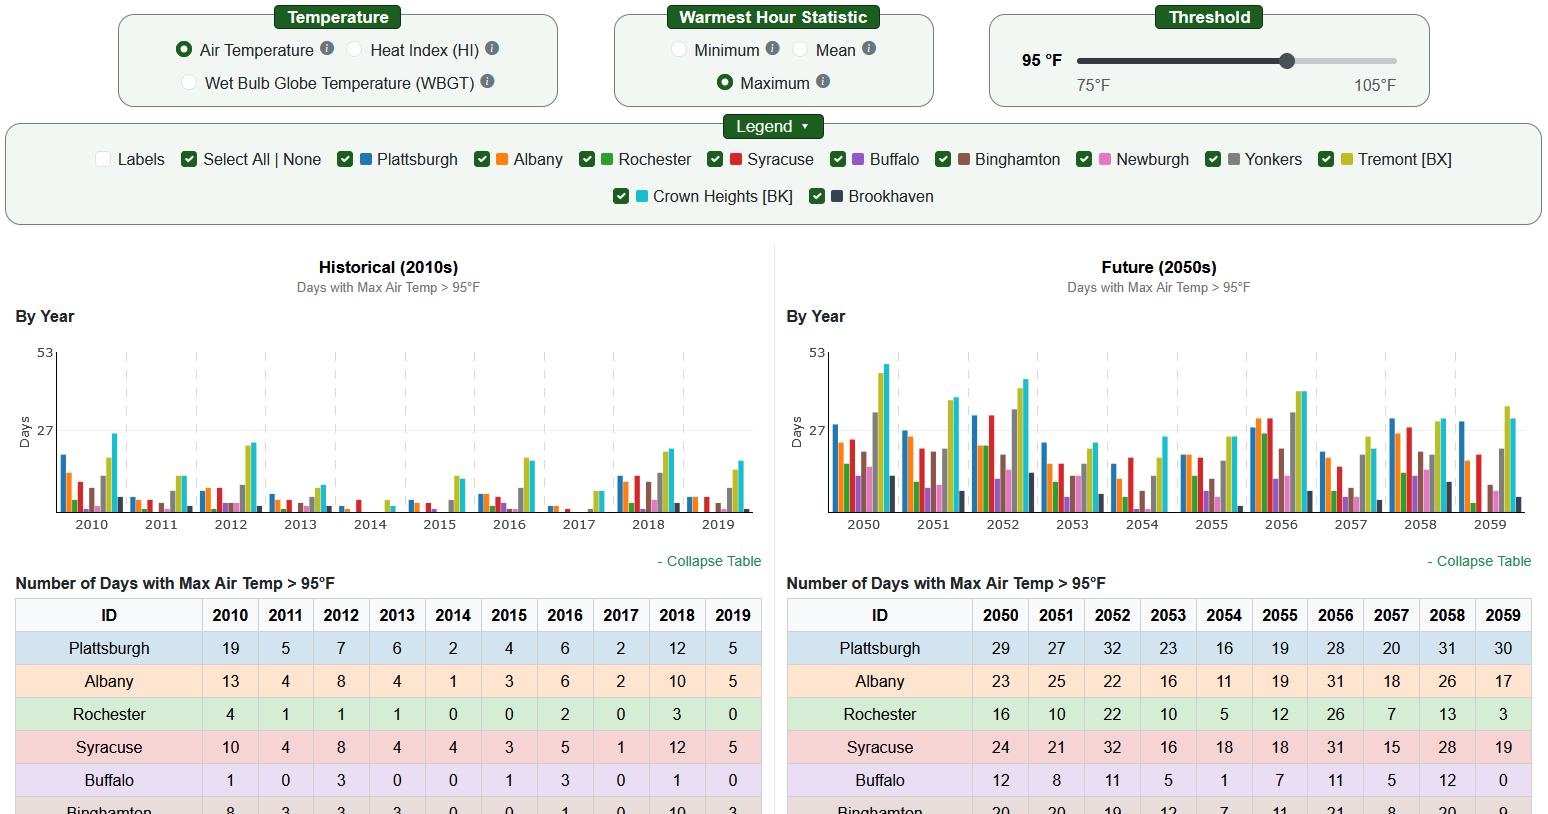
Communication and coordination — Maps, tables, and graphs can help communicate
heat patterns to communities and decision-makers. The results can support conversations with public
health, emergency-management, planning, and infrastructure professionals.
About the Data
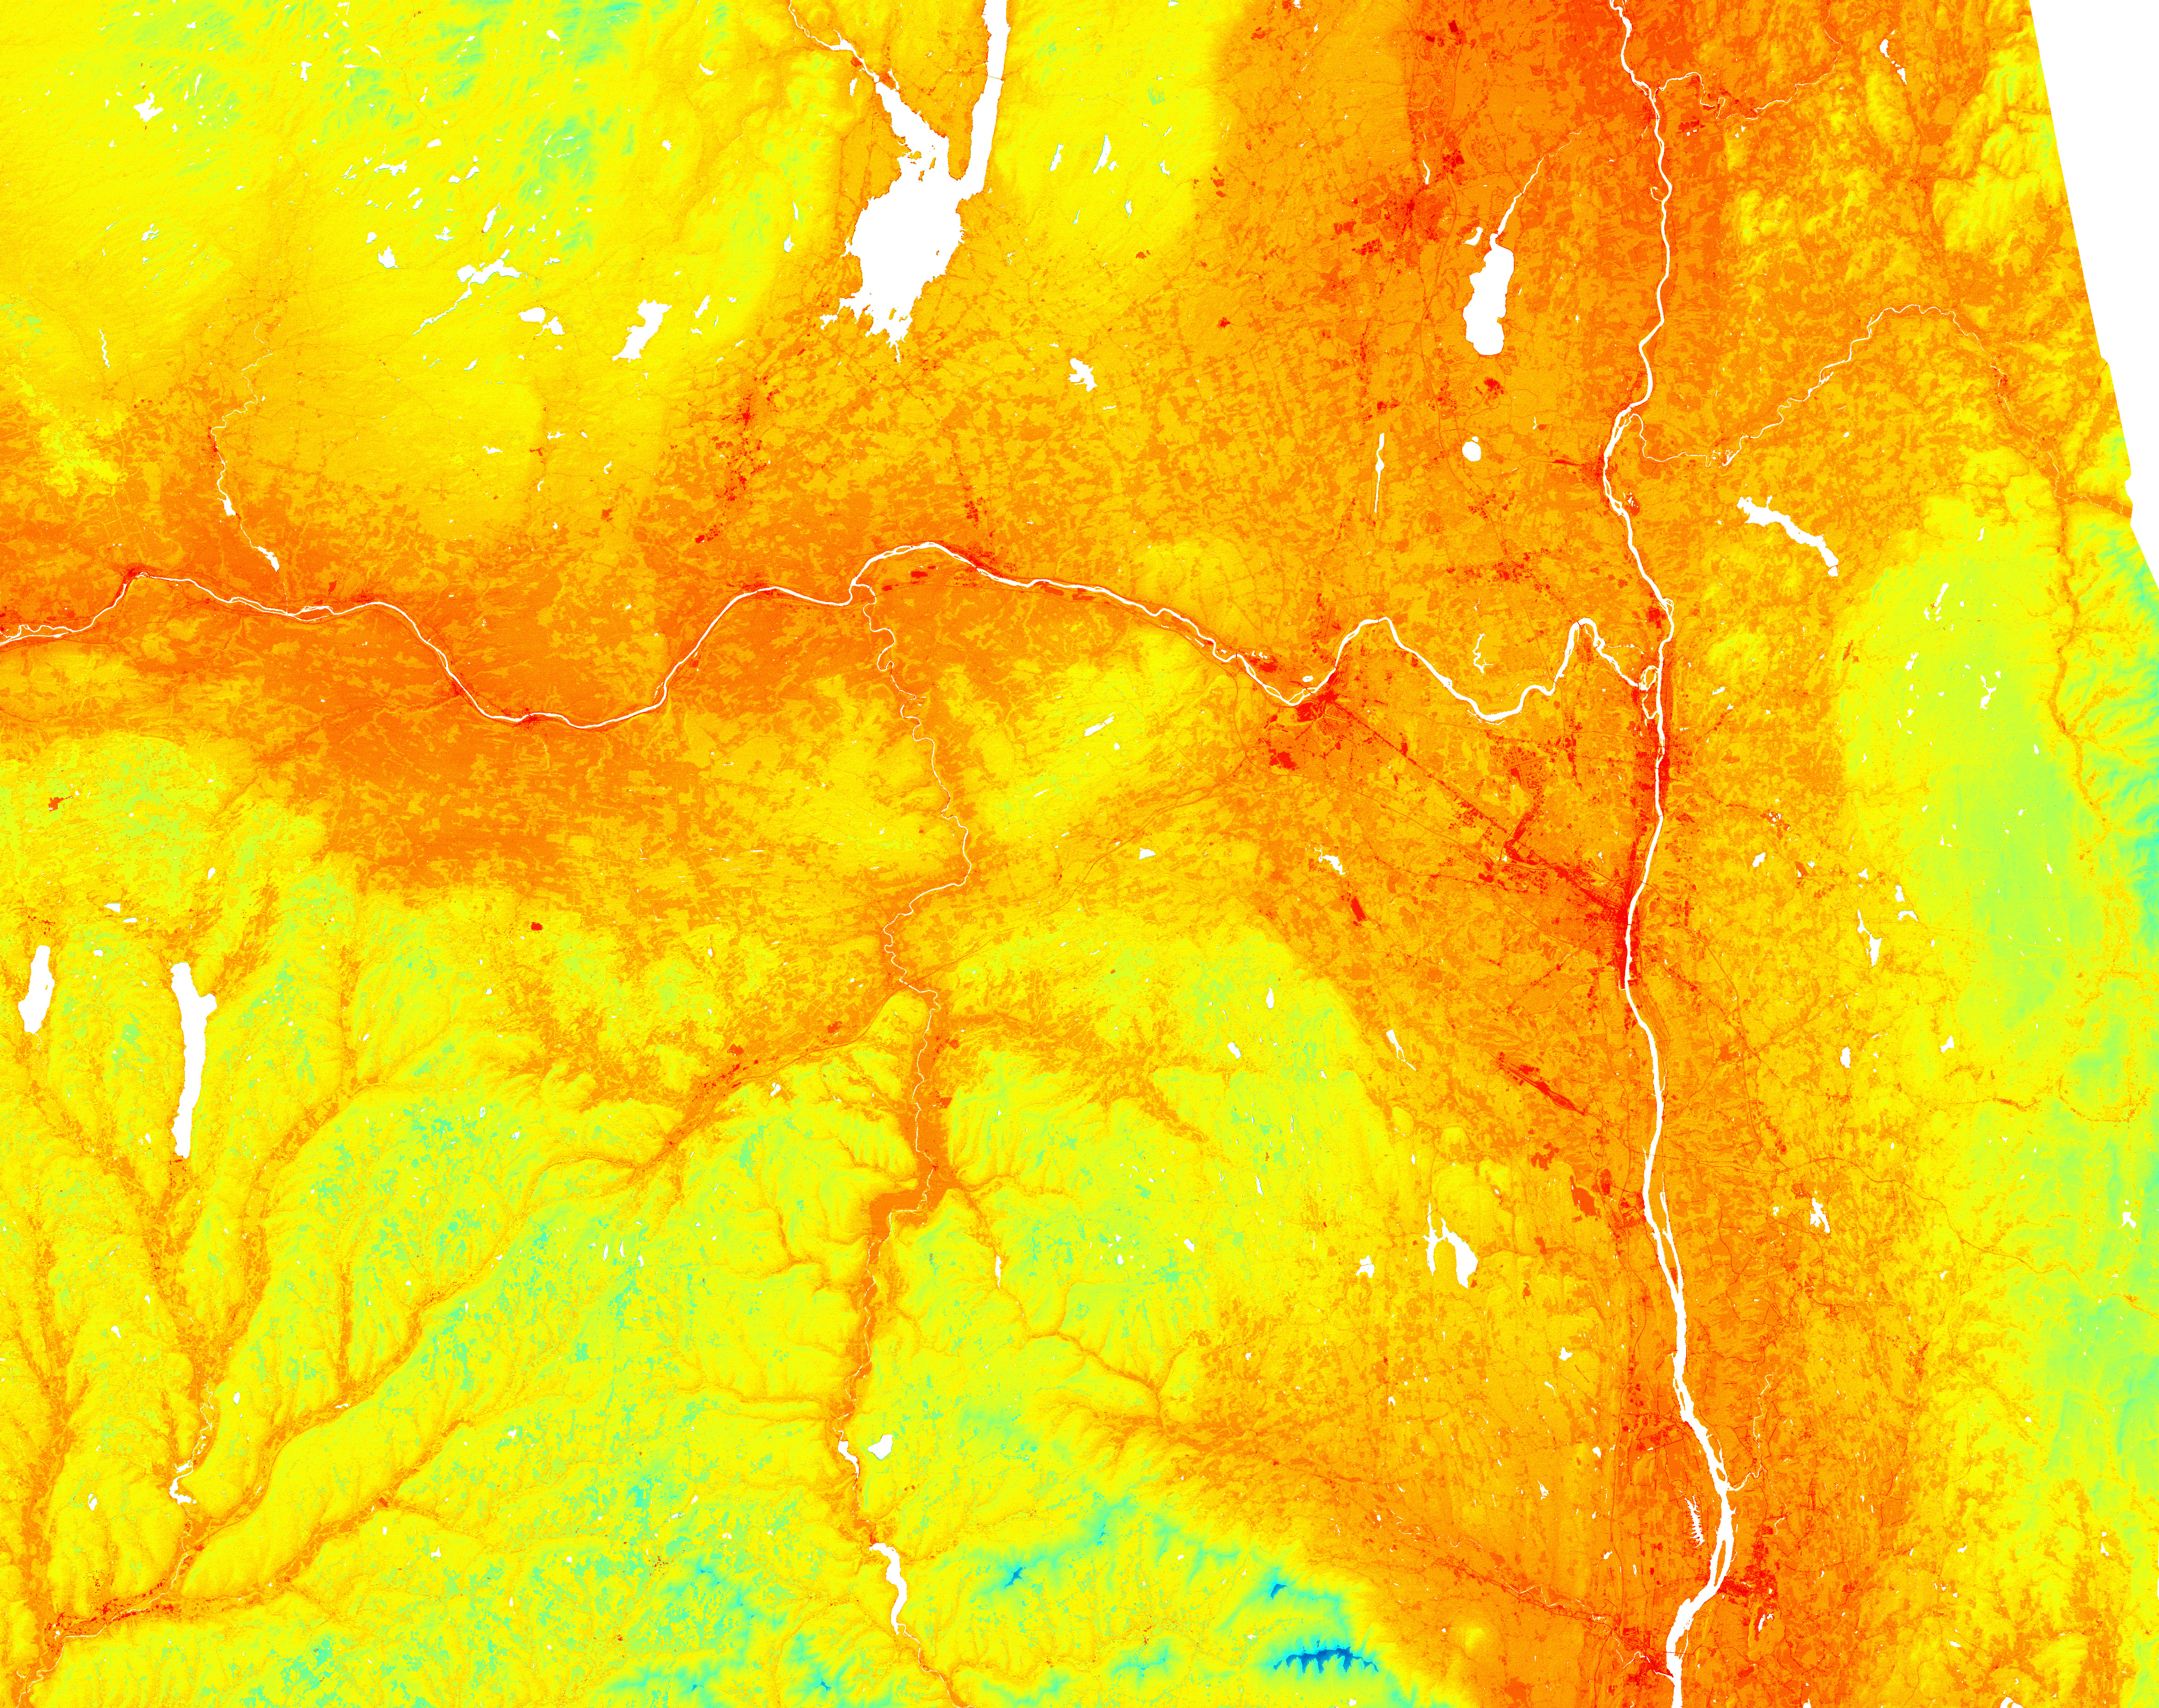
The temperature data presented in these tools are generated using the i-Tree Cool Air model, a spatial air
temperature and humidity model. For details about the temperature modeling and
datasets used, see the i-Tree Cool Air Model Methods. The historical and future weather input
into the model is from the Thermodynamic Global Warming Dataset.
The toolkit was developed through a partnership among the Davey Tree Expert Company, the NYS Department of Environmental
Conservation, and SUNY College of Environmental Science and Forestry. These tools are for planning purposes only.
They are not intended to provide real-time weather information or serve as the sole basis for emergency response,
public health, engineering, or site-specific investment decisions.
Partner with the i-Tree Team
Beyond our publicly available tools, the i-Tree team offers contracted services, including custom simulations,
specialized reports, expert consultation, and the development of tailored modeling tools.
Whether you're seeking a one-time analysis or planning a larger project, contact
info@itreetools.org to discuss your needs and explore
opportunities for collaboration.