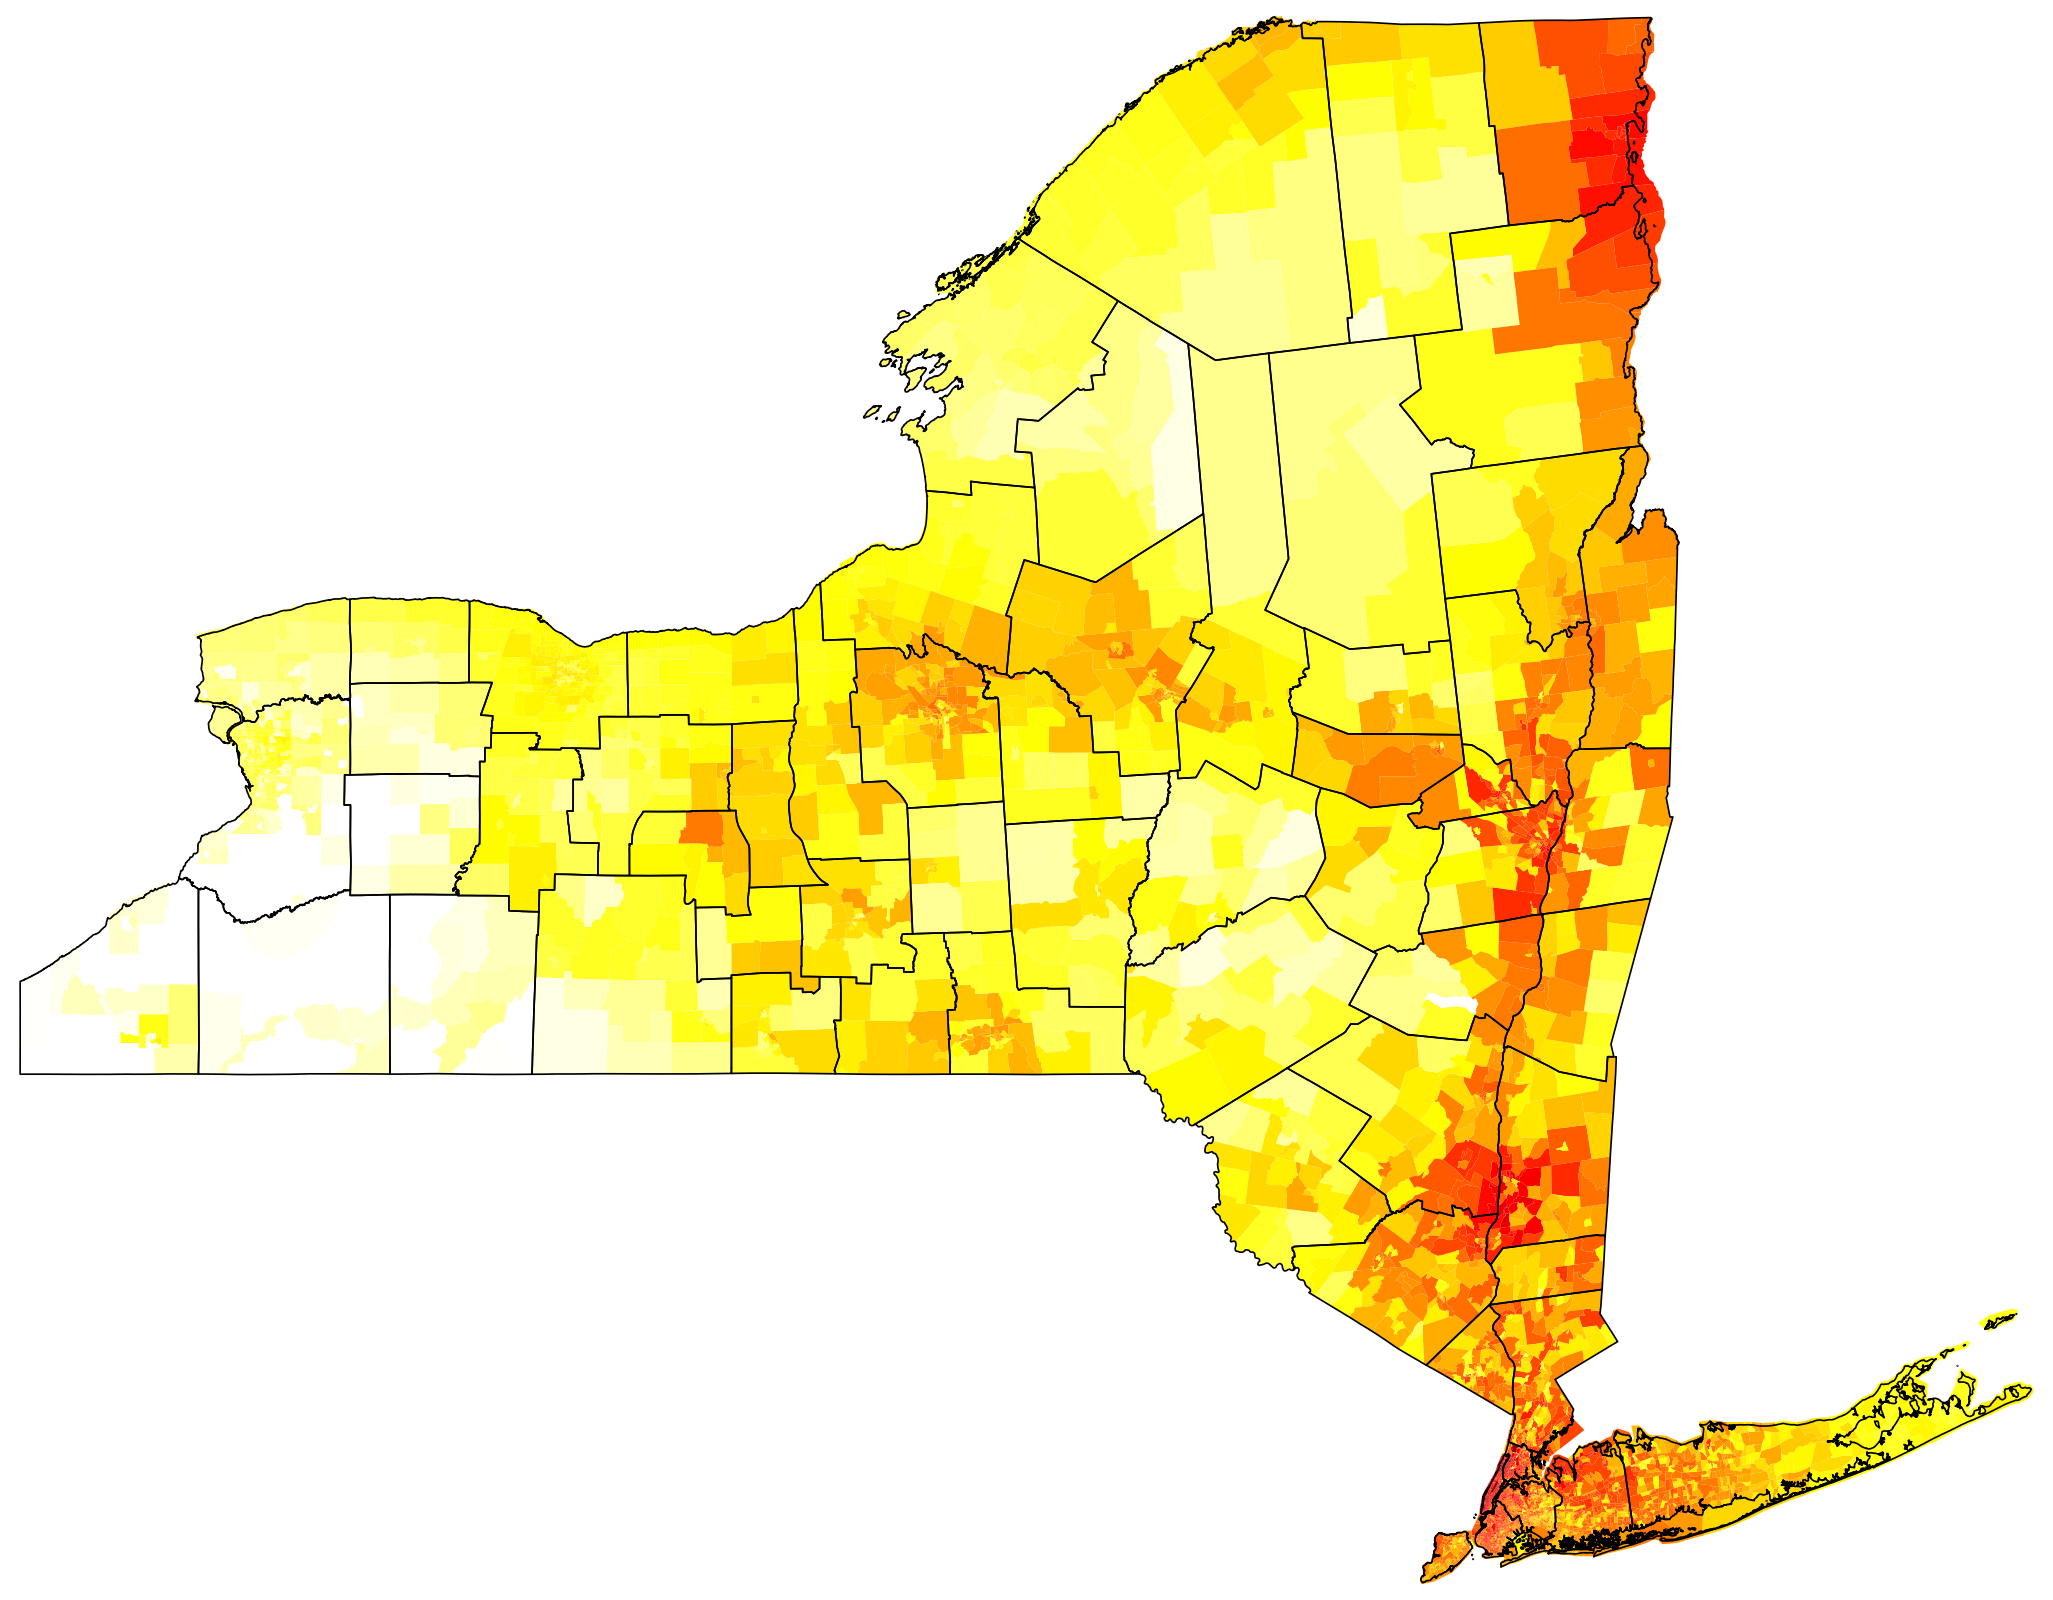
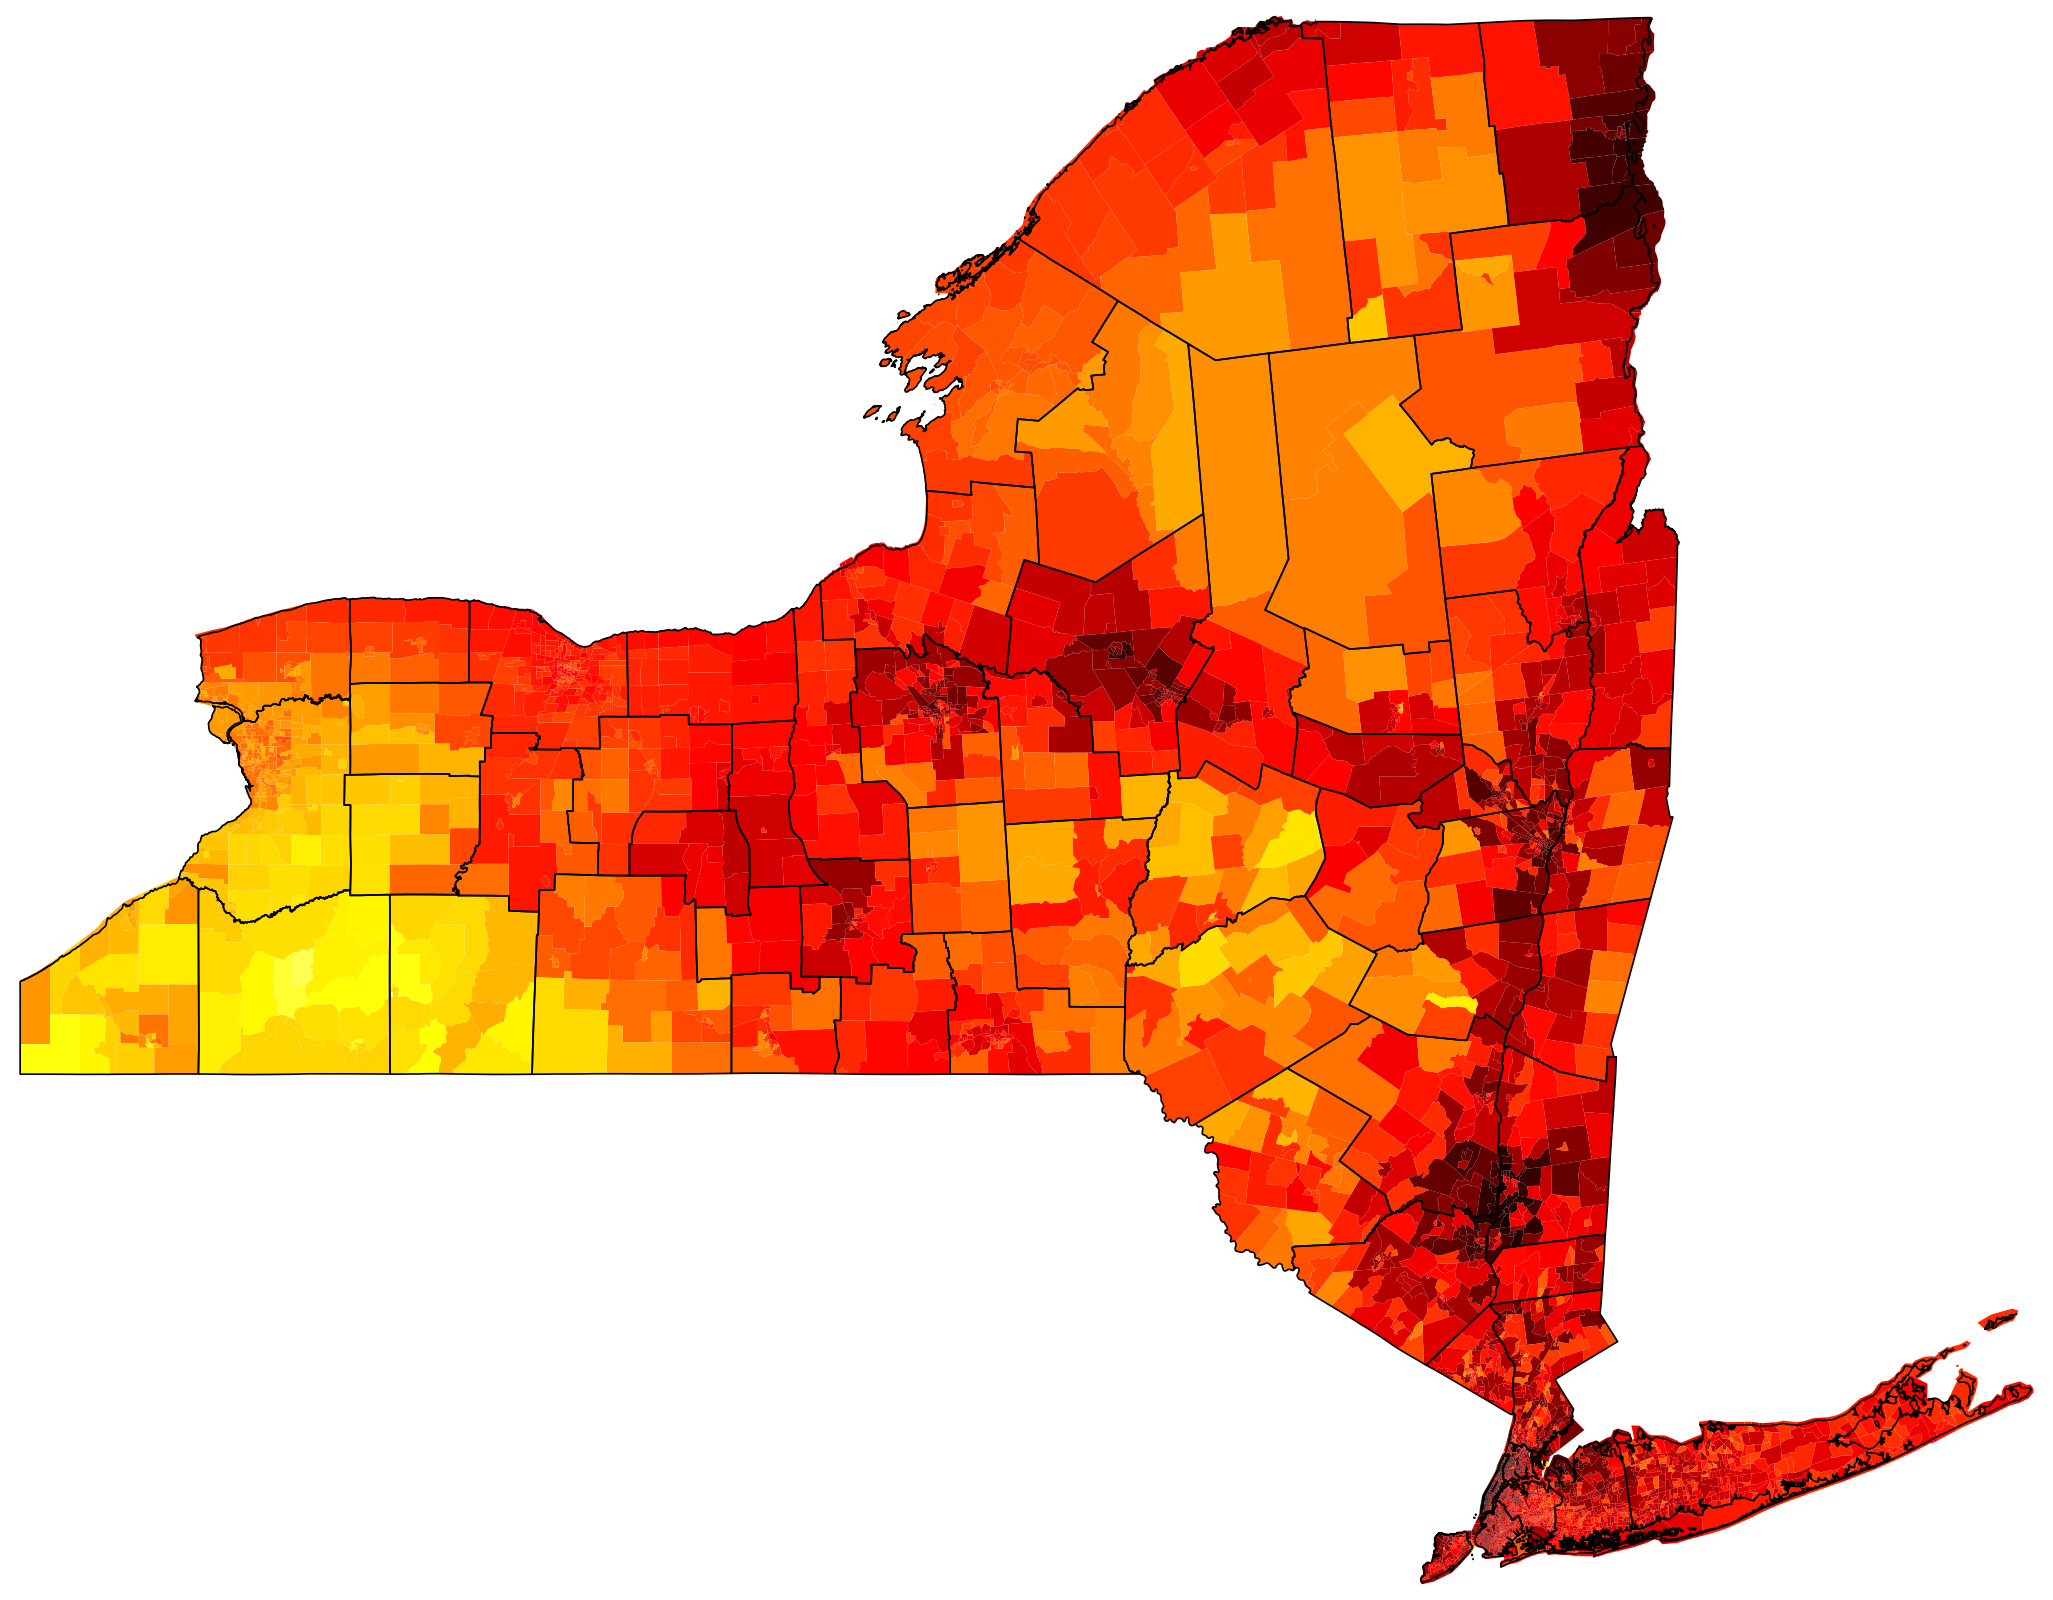
About the Thermodynamic Global Warming (TGW) Dataset
The Thermodynamic Global Warming (TGW) dataset used for weather inputs is designed to examine how weather patterns that historically brought heat to New York State may behave under warmer future climate conditions. Historical and future scenarios were developed using a thermodynamic global warming approach, in which past weather is first reproduced from reanalysis data and then replayed under future SSP245 climate conditions using climate-change signals derived from global climate models.
For this tool, the selected periods are 2010-2019 for the historical scenario and 2050-2059 for the future scenario.
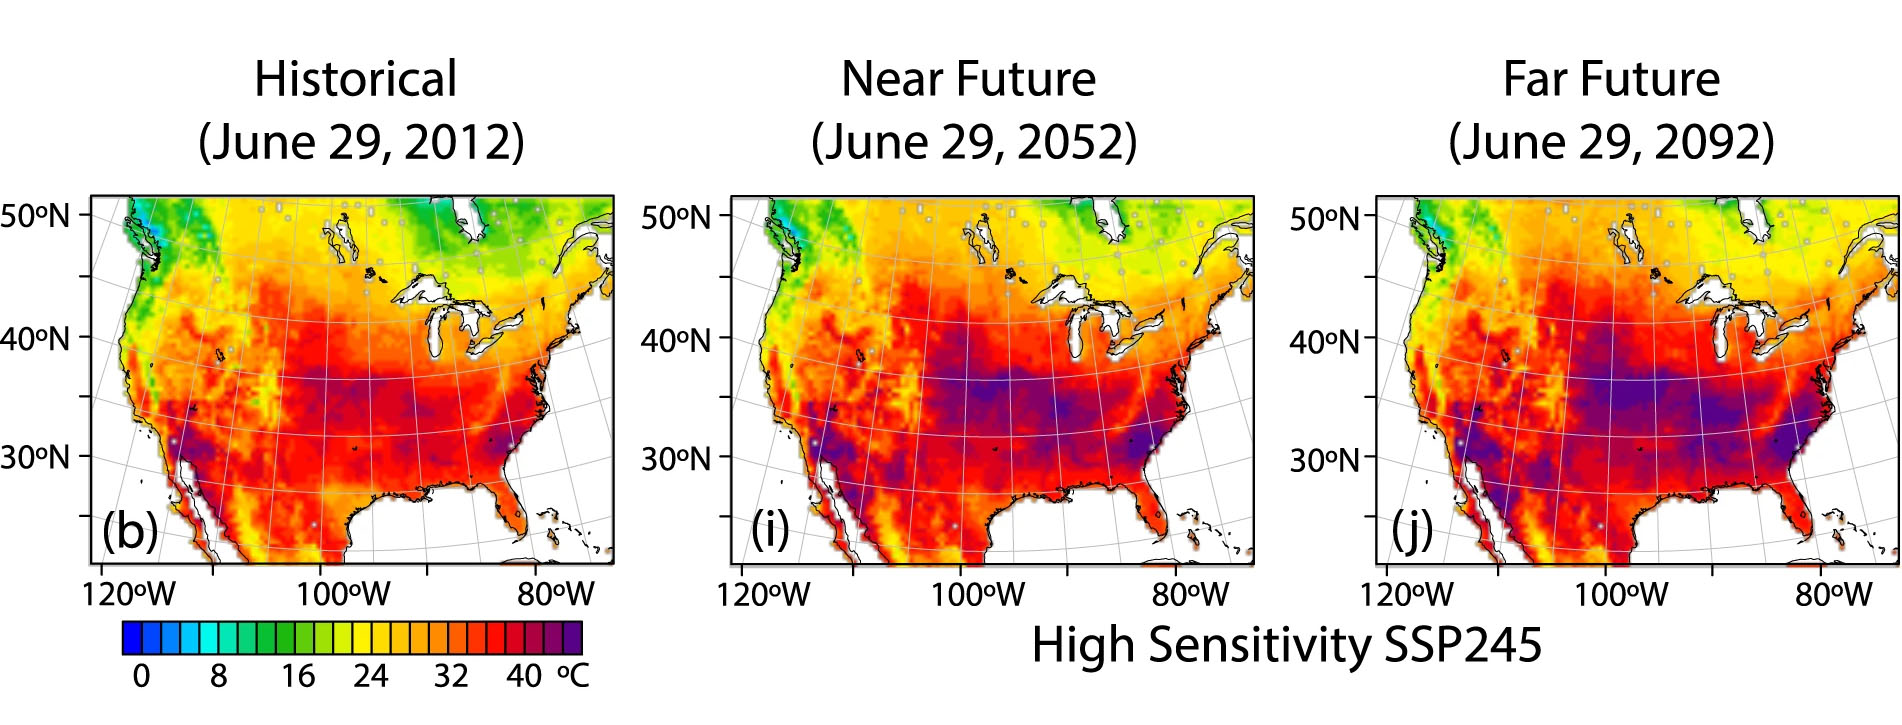
Because the same underlying weather events are represented in both periods, the dataset is useful for direct comparison of how heat-related conditions may change under warming. This includes changes in event intensity, duration, geographic extent, and whether conditions that were once below the 95°F Heat Index threshold for a heat advisory now surpass that condition. The dataset provides hourly, physically consistent weather information across variables like temperature and surface pressure. They are not intended to estimate changes in the future frequency of given large-scale weather patterns.
Read more about the TGW Simulations and access the paper on the TGW Homepage. Data was retrieved from "historical" and "rcp45hotter" on the TGW Downloads page.
Conversion for Cool Air Inputs
The i-Tree Cool Air model requires weather inputs such as air temperature, dew point, net solar radiation, wind speed, and precipitation. To create those inputs from the climate projections, values were extracted for 28 existing weather station locations using the modeled grid cell at each site. Many temperature- and moisture-related variables were then translated into the format needed by the model.
Additional calculations were required for select radiation variables. While the climate projections provide total incoming solar radiation and downward longwave radiation, heat modeling also depends on how that energy is divided and exchanged. Using the radiation methodology within i-Tree workflows (source), calculations from TGW inputs estimate how much of the incoming solar radiation arrives as direct sunlight and how much is redistributed as diffuse light by the atmosphere and clouds. It also estimates the relationship between downward longwave radiation from the sky and upward longwave radiation emitted by the surface. The direct:diffuse fractions and shortwave:longwave relationships are then applied to the weather model totals so that the final radiation values remain aligned with the simulated weather while still capturing the effects of cloud cover and atmospheric conditions on how energy is distributed.
The TGW simulations were not bias-corrected upon release. This was to not suppress the extremes that can occur under a changed climate. Bias correction was performed in the processing for i-Tree Cool Air solely on precipitation, whereby stations had an over-estimation of historical and future precipitation. Historical precipitation was bias-corrected to more closely align with real-world observations, and future weather was adjusted accordingly.
Example Heat Event
The historical model contains a heat event from June 30, 2018 - July 5, 2018. The same event recreated in 2058 results in the following changes for major cities:
| City |
Maximum Temperature
(Change from 2010)
|
Maximum Heat Index
(Change from 2010)
|
Consecutive Heat Days
(Change from 2010s)
|
|---|---|---|---|
| Albany |
107.7°F
(+3.7°F)
|
125.2°F
(+9.9 °F)
|
7 days
(+3 days)
|
| Buffalo |
99.28°F
(+2.1°F)
|
117.3°F
(+20 °F)
|
5 days
(+2 days)
|
| Plattsburgh |
114.93°F
(+6.9°F)
|
124.7°F
(+8.7 °F)
|
5 days
(0 days)
|
| Yonkers |
107.56°F
(+4.5°F)
|
122.2°F
(+8.2 °F)
|
7 days
(+3 days)
|